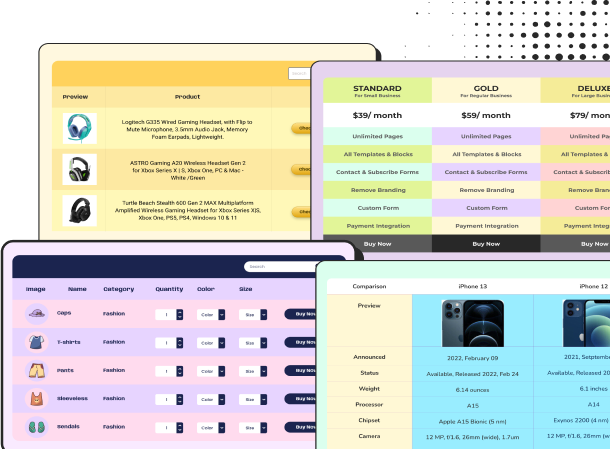
User Activity Table
Week 1 | Week 2 | Week 3 | Week 4 | |
All Users | 2.7% | 1.2% | 0.9% | 1.8% |
Jan 8 - Feb 3 | ||||
Feb 4 - Feb 10 | ||||
Feb 11 - Feb 17 | ||||
Feb 18 - Feb 24 | ||||
Feb 25 - Mar 2 | ||||
Mar 3 - Mar 9 |
Display user activity or weekly traffic density by using colors on table cells. With colors on table cells appearing as gradient, this table shows the density.
How to use this table:
This table is easy to use and customize. Just follow these steps:
- Install and activate Ninja Tables on your WordPress dashboard.
- Go to Ninja Tables → Tables → Import Table.
- Select the json file and in the import format section choose: JSON/CSV- Exported From Drag-and-Drop Tables.
- Click on the Import button and wait for the confirmation message.
After getting the success message, you can edit your table as you wish. Add or remove columns, rows, and features. Change the colors, fonts, and styles.
When you are done, save your table and copy the shortcode to your clipboard. You can paste it on any page or post where you want to display the table. Enjoy!
***This table may include some Pro features. Get Ninja Tables Pro for all-access fun!
You May Also Like
-
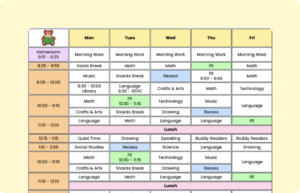
School Schedule Table
Class Schedule table for an effective class routine.
-
Posts with Responsive Breakpoints
Click the “+” icon to reveal additional post details that are initially hidden.
-

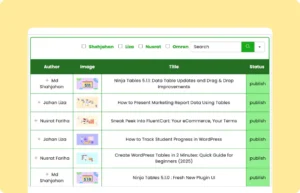
Plugins Gallery
All the plugins of a company displayed in a custom table with lightbox and links.
Craft Responsive Data Tables Fast!
Ninja Tables is the best table plugin to show data in an organized table format.