
Comparison Table Examples for Products, Pricing, and Features


Indecisions, cluelessly going back and forth between 10 tabs, and just getting more confused before a purchase- you’re not alone.
About 51% of people visit 4+ sites before finalizing a purchase. A comparison table is the ultimate solution. With the main feature highlighted, comparison tables speed up decision-making and help consumers focus on the similarities and differences on-site.
You can see tables comparing products and pricing on every website. It’s a must-have to show the audience what stands out.
We’ve curated the best comparison table example here using Ninja Tables.
No matter what you want to display or why you need a comparison table, we guarantee you’ll find something in this list. Buckle up; it’s showtime.
TL;DR
What Is a Comparison Table?
A comparison table is a simple grid, usually rows and columns, that lays out two or more products, plans, or services side by side so people can see the differences at a glance.
Instead of reading three separate product pages and trying to remember what each one offered, a comparison table example puts pricing, features, or specs right next to each other so the decision practically makes itself.
You’ll spot them everywhere, from SaaS pricing pages to review blogs to online stores comparing gadgets. The format stays the same. Only the content inside changes depending on what you’re comparing.
Why Comparison Tables Work
The internet gives shoppers too many choices, and that works against you more often than you’d think. When someone has to compare five product pages in their head, they get tired of deciding, and tired shoppers tend to just leave.
A comparison table template removes that mental math. It puts every option on one screen, using the same categories side by side, so the differences become obvious instead of buried in paragraphs.
That’s why you’ll see comparative tables everywhere from pricing pages to review blogs. They don’t just organize information; they actually help people decide faster.
When Do You Need a Comparison Table?
While comparison tables are commonly associated with high-involvement purchases, their utility extends beyond product comparisons. They are equally effective for:
- Weighing the pros and cons of review posts and blogs
- Highlighting your preferred products or services to draw attention
- Comparing basic characteristics of items for a quick overview
- Subscription or package-based services, to show different features that come with each pricing plan or bundle
- Best-selling products by highlighting their specialty and quality over competitors
- Showing features listed under price as to why your product is priced the way it is, and why it’s better than competitors
4 Types of WordPress Comparison Table Examples by Use Case
WordPress comparison table design is restrictive, leaving little to no room for customization. To get desired layouts, your last resort is to use custom code. Rather than building your table from scratch, WordPress table plugins save you time and effort.
More importantly, Ninja Tables makes it easy to create side-by-side product comparisons without hassle. With user-friendly customization and flexible layouts, you can effortlessly tailor tables to your liking without dealing with complex code.
Pricing comparison table
First up is a well-kept pricing comparison table design in Ninja Tables.
Over half (53%) of consumers prefer accessing competitors pricing on a retailer’s website, reducing the need to compare shop elsewhere.
Form Plugin | Basic | Pro | Elite |
 | $109/ Per year | $169/ Per year | $369/ Per year |
 Ninja Tables | $79/ Per year | $129/ Per year | $299/ Per year |
 | $49/ Per year | $79/ Per year | $399/ Per year |
For your own service packages or products, pricing tables simplify product comparison, enabling customers to evaluate features easily and make informed decisions.
Single Site License 1 Domain License | Agency License 5 Domain License
| 50 Sites License 50 Domain License
|
$129 | $249 | $399 |
Annual License | Annual License | Annual License |
10 Business Email Piping | 50 Business Email Piping | 500 Business Email Piping |
Unlimited Email Parsing | Unlimited Email Parsing | Unlimited Email Parsing |
1 Year Plugin Update | 1 Year Plugin Update | 1 Year Plugin Update |
1 Year Priority Support | 1 Year Priority Support | 1 Year Priority Support |
All Features Included | All Features Included | All Features Included |
It gives customers clear information and freedom to choose the plan that’s right for them.
 Pricing: Product X
Released: July 2025
Seller: ElectroMag
| Plan | Monthly | Annually | You save | USP | Action |
|---|---|---|---|---|---|
Agency | $159 | $1590 | 10% | 24/7 support | Buy |
Professional | $79 | $790 | 20% | AI infusion | Buy |
Starter | $29 | $290 | 17% | Drag-and-drop | Buy |
A horizontal pricing table like this clearly shows which pricing tier is the best option. It also shows a short product detail.
A membership plan comparison table can make a huge difference when displaying digital assets in each tier, for example, in a course community space.
Popular Pro Photographer For Aspiring Professionals $29.99 per month Take your photography to the next level with advanced training and feedback All Features of Photo Enthusiast Advanced Photography Courses Live Workshops (Monthly) Expert Photo Reviews Lightroom Presets & Templates Exclusive Content Priority Support | Studio Pro For Professionals & Creators $79.99 per month Get full access to premium resources, one-on-one support, and grow your photography business Everything in Pro Photographer 1-on-1 Mentorship Calls Business & Branding Courses Portfolio Guidance and Reviews Early Access to New Courses VIP Community Access | |
All plans include a 7-day-money-back guarantee. Cancel Anytime! | ||
Web hosting companies lean on this same format constantly. A web hosting comparison table showing storage, bandwidth, and renewal pricing side by side helps visitors pick a plan in seconds instead of opening five hosting sites in five different tabs.
Feature | Starter | Business | Best Value Professional | Enterprise |
Price / Month | $3.99 | $6.99 | $10.99 | $19.99 |
Websites | 1 | 5 | 20 | Unlimited |
Storage | 10 GB SSD | 30 GB SSD | 75 GB SSD | 150 GB SSD |
Bandwidth | 100 GB | Unlimited | Unlimited | Unlimited |
Free SSL | ||||
Free Domain | — | |||
Email Accounts | 5 | 25 | 100 | Unlimited |
Daily Backups | — | |||
CDN | — | |||
Priority Support | — | — | ||
Free Migration | — | |||
Best For | Personal Sites | Small Businesses | Growing Websites | Large Businesses |
Action |
Product comparison table examples
The purchase decision is a complex process. Choosing between similar products can be stressful. Comparing them across different pages is frustrating and confusing.
You can simplify this process with a product comparison table to provide a better user shopping experience.
Take this iPhone model comparison table as an example. Instead of jumping between two product pages to check specs, screen size, or battery life, shoppers get everything laid out side by side on one page.
It’s a small addition, but it’s exactly the kind of detail that keeps visitors on your site instead of bouncing off to compare elsewhere.
Comparison | iPhone 13 | iPhone12 |
Preview |  |  |
Announced | 2022, February 09 | 2021, September 13 |
Status | Available. Released 2022, February 24 | Available. Released 2021, September 25 |
Size | 6.1 inches | 6.1 inches |
Weight | 6.14 ounces | 5.78 ounces |
Processor | A15 | A14 |
Chipset | Apple A15 Bionic (5 nm) | Exynos 2200 (4 nm) - Europe |
Camera | 12 MP, f/1.6, 26mm (wide), 1.7µm,
dual pixel PDAF, sensor-shift OIS | 12 MP, f/1.6, 26mm (wide), 1.7µm,
dual pixel PDAF, sensor-shift OIS |
Battery | Li-Ion 3240 mAh, non-removable | Li-Ion 3000 mAh, non-removable |
Resolution | 2532x1170 | 2532x1170 |
Pros and cons table
If you write review posts, consider using pros and cons tables to highlight the advantages and drawbacks of products/services.
Pros and cons tables provide quick summaries of products or topics, enhancing the overall reading experience.
Use it as a good content break and hook the reader. Want to know how a pros and cons table actually helps users make faster, more confident decisions? Our guide ‘Simplify Your Decisions with Pros and Cons Tables‘ breaks down the logic behind it, touches on user behavior patterns, and shows why this format works so well in real-world scenarios.
 | |
PROS | CONS |
Affordable pricing plan | No free trial |
No Ad interruption | Buffering/low video quality |
Lots of content choices | Regional content limitation |
Original tv shows and movies | Delayed release |
Varied audio/subtitle options | Unsatisfactory dubbing |
Multiple platform choice | Account Sharing Challenges |
Feature comparison table
People often compare options before making purchase decisions. Whether it’s choosing a product or service provider, finding the best deal comes naturally with the process.
We often prioritize price and performance and compare features when making decisions. Comparing options and highlighting similarities and differences helps users choose the best fit for their needs.
Here’s a detailed guide on creating a feature comparison table that’s more effective than you might expect, both in function and impact!
| Features | Ninja Tables | wpDataTables | TablePress | WP Table Builder | ||||
|---|---|---|---|---|---|---|---|---|
| WooCommerce |  |  | | | ||||
| Google Sheet data sync | | | | | ||||
| Fluent Forms | | | | | ||||
| WP Posts | | | | | ||||
| Charts | | | | | ||||
| Simple Table Creation Options | ||||||||
| Drag & drop | | | | | ||||
| Pre-built templates | | | | | ||||
| Conditional formatting | | | | | ||||
| Table design | | | | | ||||
These are some of the most popular and widely used comparison charts, and for good reason. Now that you’ve got the overview, you’re probably thinking, “Wouldn’t it be helpful to see some real-life use cases?” We thought the same.
To start, check out this blog showcasing a perfect insurance comparison table in action. Here’s a quick example:
Toolbox Pro | Aviva | Cover My Tools | |
Aug 2023 quote for standard vehicle and $5000 tools value | $184.81 | $130.70 | $264.94 (Includes DataTag marking system) |
Available as a standalone policy | (Qouted price depends on the purhcasing $2m public liability insurance @ $370) | ||
Limited to specified vehicle | (limited) | ||
Overnight cover | (parking restrictions apply) | ||
Away from home cover | (only 24hrs if unattended) | ||
Electronics covered (1 Business laptop and phone only) | (one device only) | ||
Standard excess | $100 | $250 | $200 |
Settlement deductions | (N.B any remaining installments due if premium paid monthly) | ||
Basis of valuation | (original purchase price paid) | (depreciated cost based) | (Replacement via insurers preferred supplier) |
Proof of forced entry required | (required) |
Free Comparison Table Templates You Can Use Today
Building a comparison table example from scratch takes time you probably don’t have. That’s exactly why we built ready-made templates for each type covered above:
- Pricing comparison table template for plans, packages, or subscription tiers
- Product comparison template, for specs, features, or side-by-side product details
- Pros and cons table template for review posts and buying guides
- Feature comparison table template, for comparing tools or software side by side
Grab any of these, drop in your own content, and you’ll have a working comparison table live on your site in minutes, no coding needed.
Get table templates for free
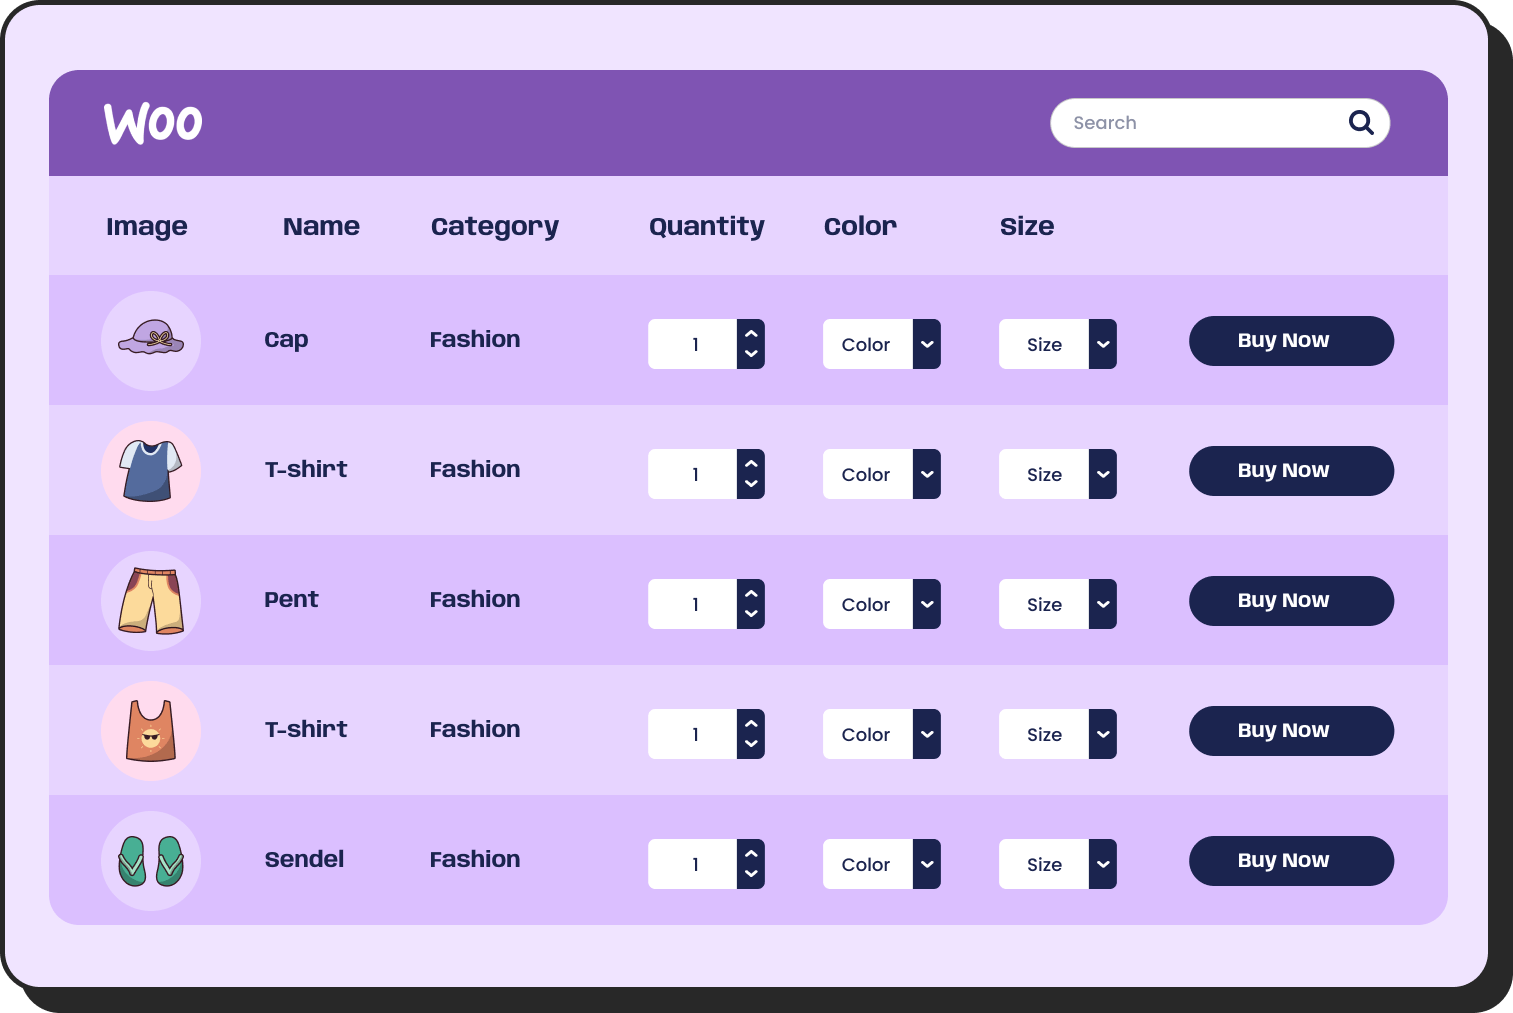
WooCommerce
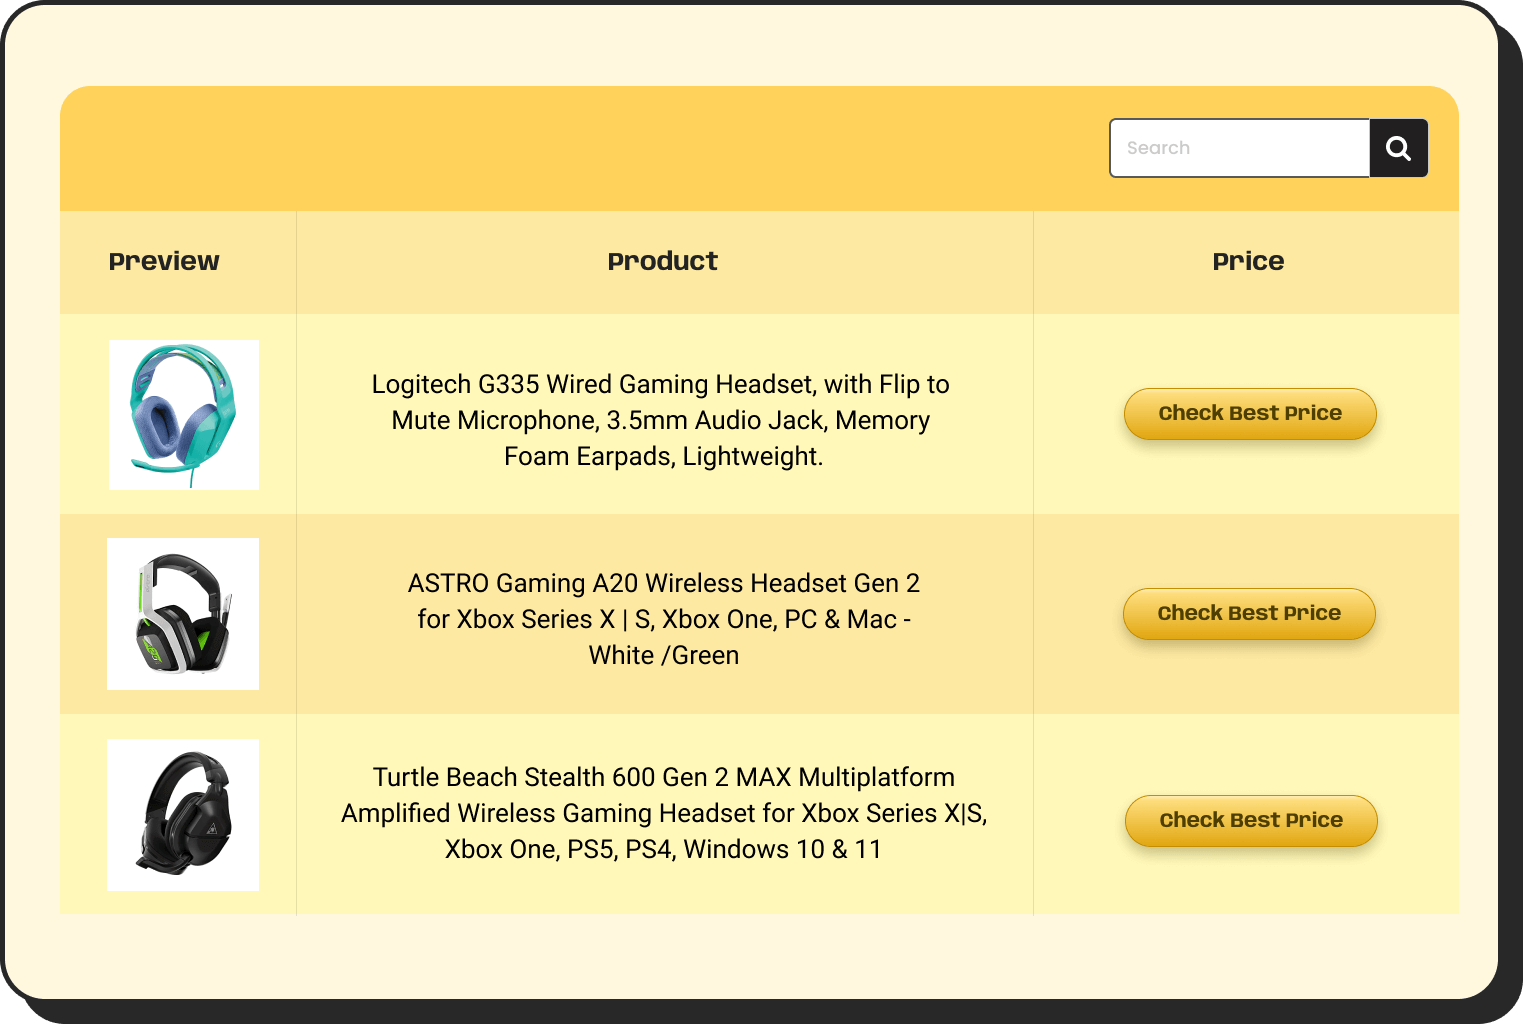
Amazon Products
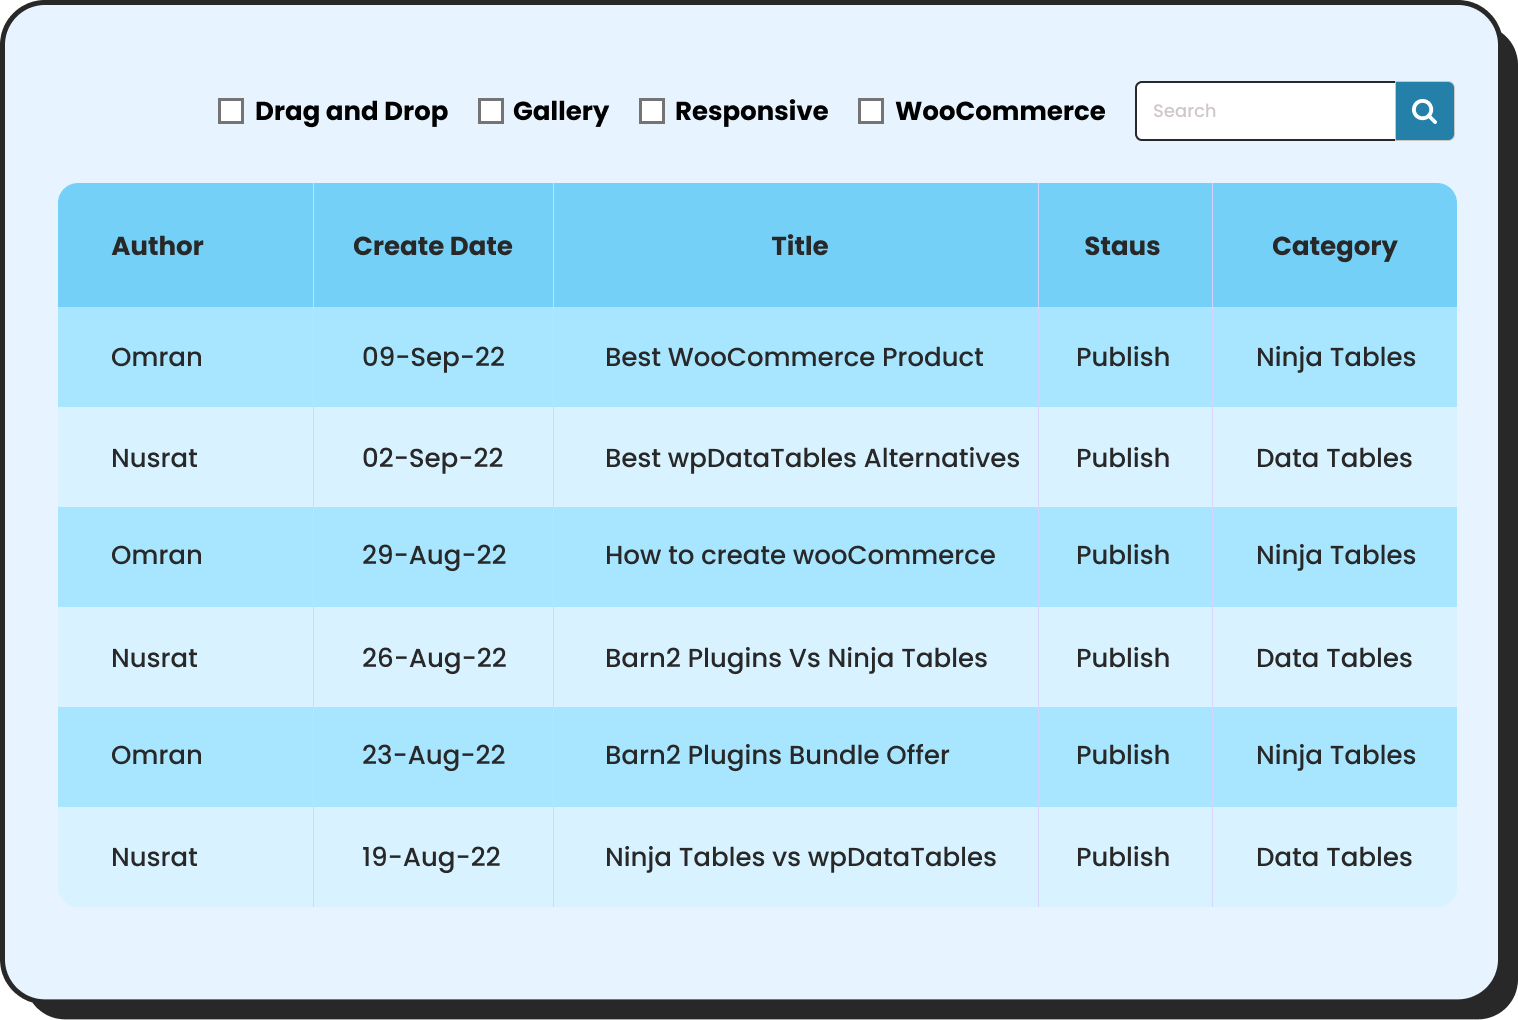
WP Posts
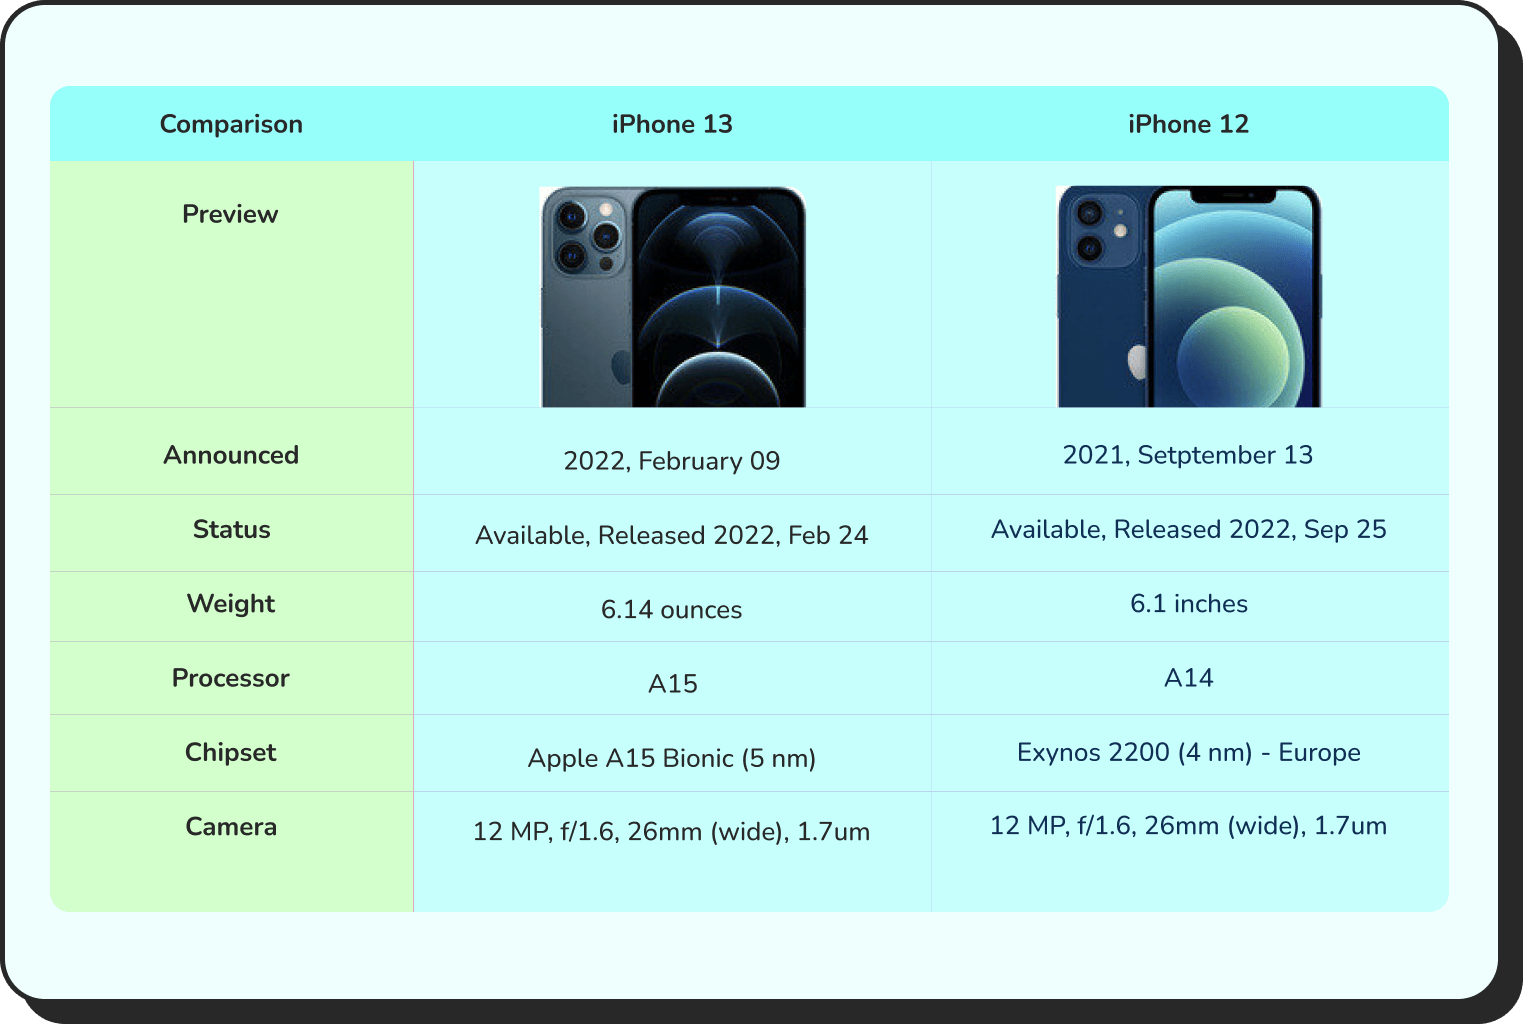
Products Comparison
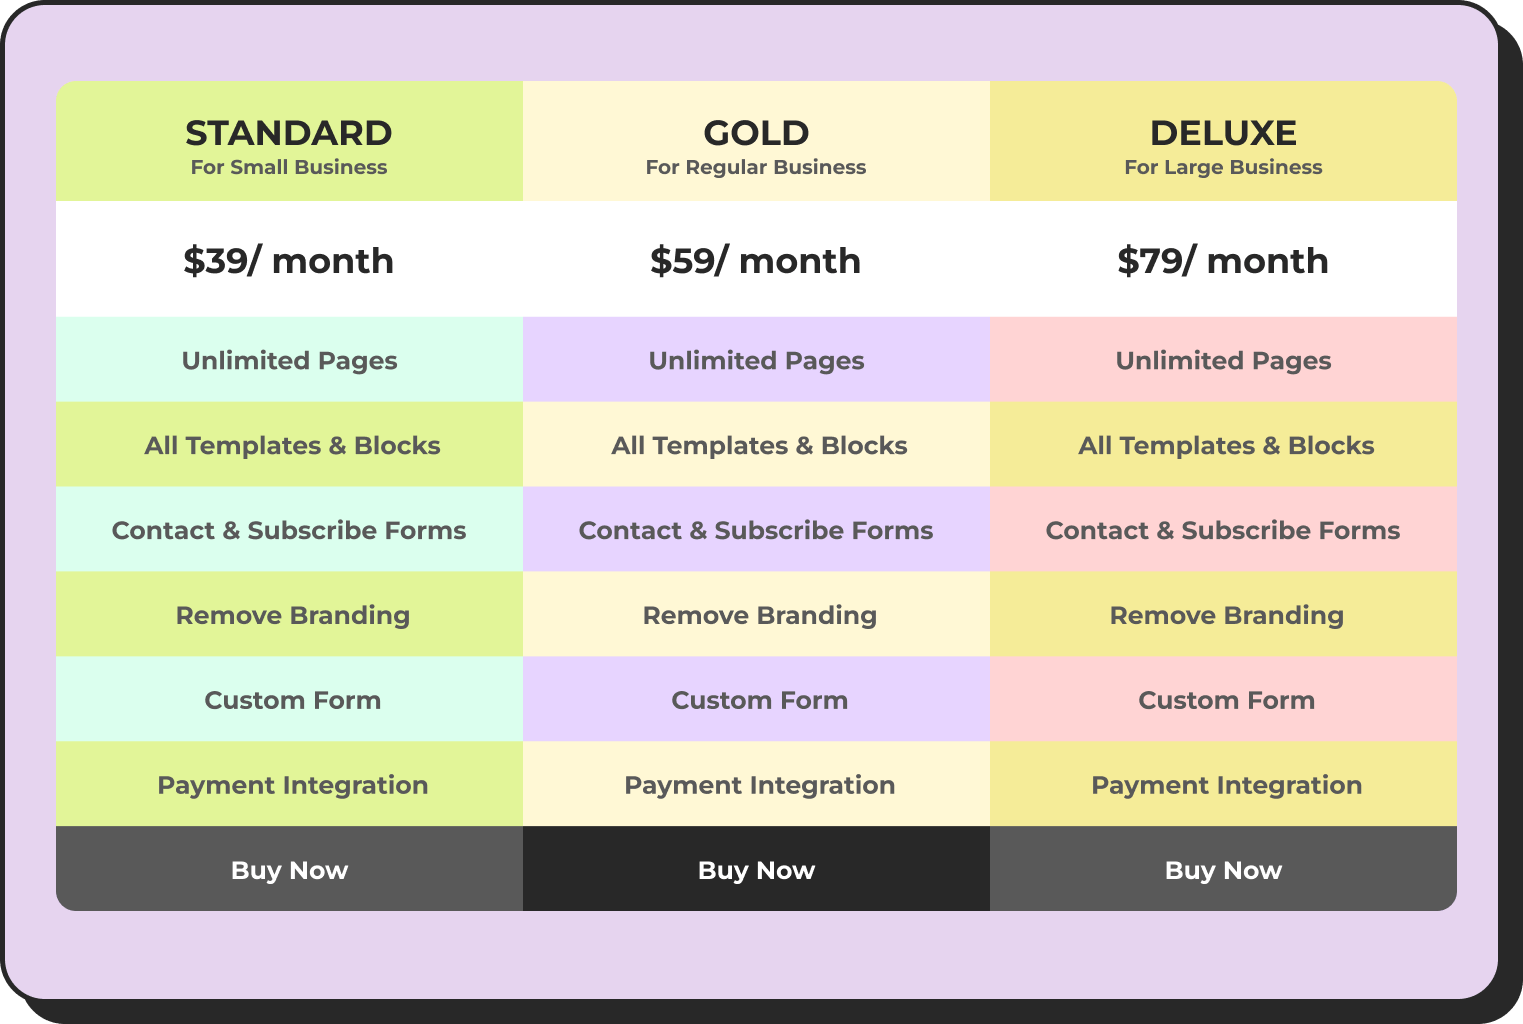
Pricing Table
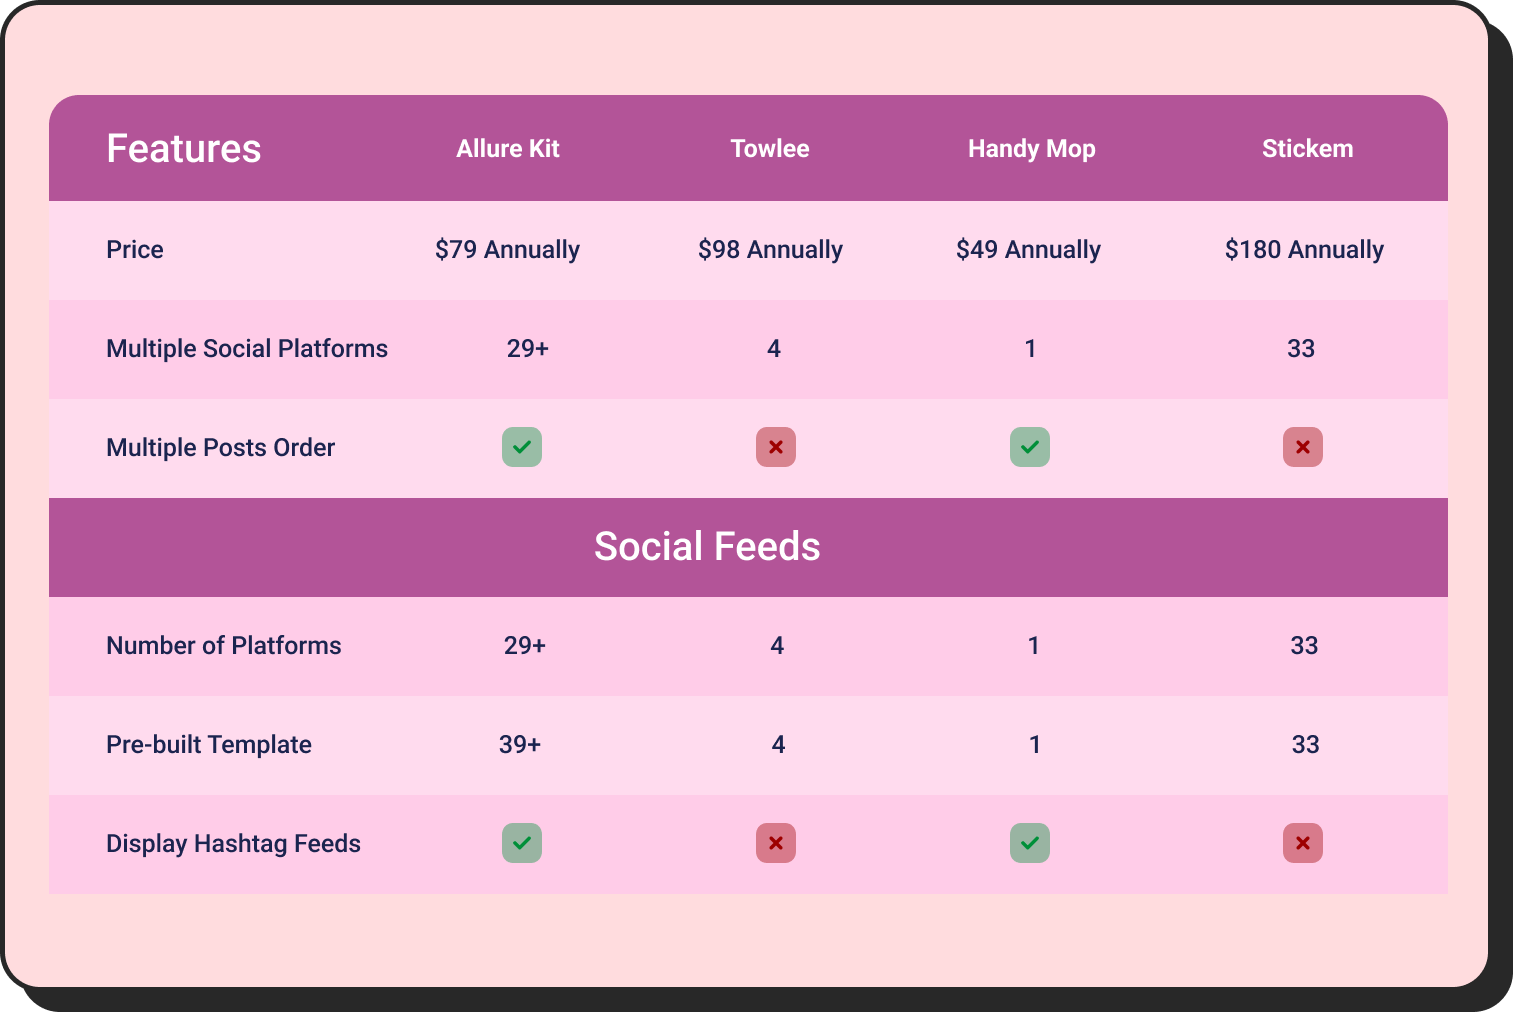
Features Comparison
Benefits of Using Comparison Tables on Your Site
Comparison shopping is crucial for convenience. For instance, 58% of consumers expect retailers to provide on-site comparative pricing tools. This is where comparison tables shine.
Here are a few good reasons why this strategy is effective:
- Tables increase the readability of your content.
- Comparison tables easily show differences and go into more detail.
- Information laid out simply in plain sight reduces bounce rate.
- It’s easier to skim through without jamming all the information.
- The rows and columns format makes it easier to compare similar data.
- Communicate information clearly and precisely to make the best choice.
- Feature-based to help users pick the most appropriate plan.
- Highlights the main features of product similarities and differences.
- The pairing of information eases readability and comprehension.
- Make the detailed information stand out more than any other.
- Gives a clear understanding of why they should choose one over the other.
Comparison Table Design Best Practices
A product comparison table can also have some pitfalls if not used properly. Hence, it’s essential to abide by some of the best practices for a clear and intuitive comparison table design.
Start with the features that matter most.
Don’t try to compare everything. Pick the handful of features your visitors actually care about, usually price, top features, and one or two real differentiators. A table with 20 rows is exhausting, not helpful.
Make the best option obvious.
Whether it’s a “most popular” badge, a highlighted column, or a subtle background tint, guide the eye toward the option you want people to notice. Just keep it honest. If every plan is labeled “best value,” none of them are.
Keep the layout scannable.
Side-by-side columns work well for 2 to 4 items. Beyond that, switch to a vertical layout, an accordion, or split the table into sections like pricing, features, and support instead of one long grid.
Design for mobile first.
More than half your traffic is probably on a phone. If your table doesn’t scroll smoothly, collapse into cards, or let people swipe between columns, most visitors give up before they finish comparing. Check the mobile view before anything else.
Related read: Mobile-First Table Design Principles for 2026
Use visual cues instead of walls of text.
Checkmarks, small icons, and short labels communicate faster than full sentences. A green check next to “24/7 support” reads faster than a sentence explaining it.
Leave room to breathe.
Cramming every pixel with information makes a table harder to read, not easier. Enough white space between rows and columns keeps the eye from losing its place, especially on longer tables.
Keep it accessible.
Add proper alt text to icons and images, make sure color isn’t the only way you’re showing a difference (colorblind visitors won’t catch red versus green cells), and check that the table still makes sense to a screen reader.
Stay unbiased.
If you’re comparing your product against competitors, resist the urge to highlight only your strengths and bury your weaknesses. Visitors notice when a table is stacked, and it costs you trust fast.
For more tips and tricks like this, we are here with regular updates exclusively for you.
The Golden Rule of Comparison Tables
Information scattered across separate pages burdens users to memorize or open multiple tabs. Moving back and forth among them to compare and contrast choices creates confusion.
It’s a time-consuming and somewhat unorganized process, which can ultimately deter buyers. Displaying features, pricing, or other aspects in comparison tables is the only way to go.
Rather than depending on the WordPress comparison table, make your way with easy comparison table generator plugins. For starters, you can try Ninja Tables. It’s the only table plugin most equipped to give you anything you need!
Comparison tables alone won’t cut it. Sometimes viewers need a nudge to get the visual elements that can help them make a purchase decision. That’s where comparison charts come in, perfect for highlighting differences and trends at a glance. But installing yet another plugin with an annual fee, a clunky and bloated interface, or a complicated setup? No thanks.
You don’t have to, if you don’t want to! How? With Ninja Charts, built right into Ninja Tables, you can turn your table data into stunning charts in just a few clicks.
To help you get started, here’s a guide on 7 types of comparison chart examples to help you understand all the use cases and workarounds.
FAQs
What makes a comparison table trustworthy?
Transparency. If you’re comparing your own product against competitors, showing genuine strengths and weaknesses builds more trust than only highlighting the positives.
Is it possible to add images or videos to a comparison table?
Yes! You can easily add images to your table simply by using the drag-and-drop element of Ninja Tables.
Can I make my comparison tables mobile-responsive with these plugins?
Of course! Simply click ‘Enable responsive table,’ and voila, it’s fit for any device.
Is there any icon or badge to use in any column?
Yes! There are many icon styles already added to the library. Also, you can use the ‘Ribbon’ option to use as a badge in your comparison table.
How many columns should a comparison table have?
Two to four works best for side-by-side comparisons. Beyond that, the table gets harder to scan, so consider splitting it into sections or switching to a vertical layout instead.

Ninja Tables– Easiest Table Plugin in WordPress
Get in touch with Ninja Tables
Get special discount on the best table plugin made for you!





Add your first comment to this post