
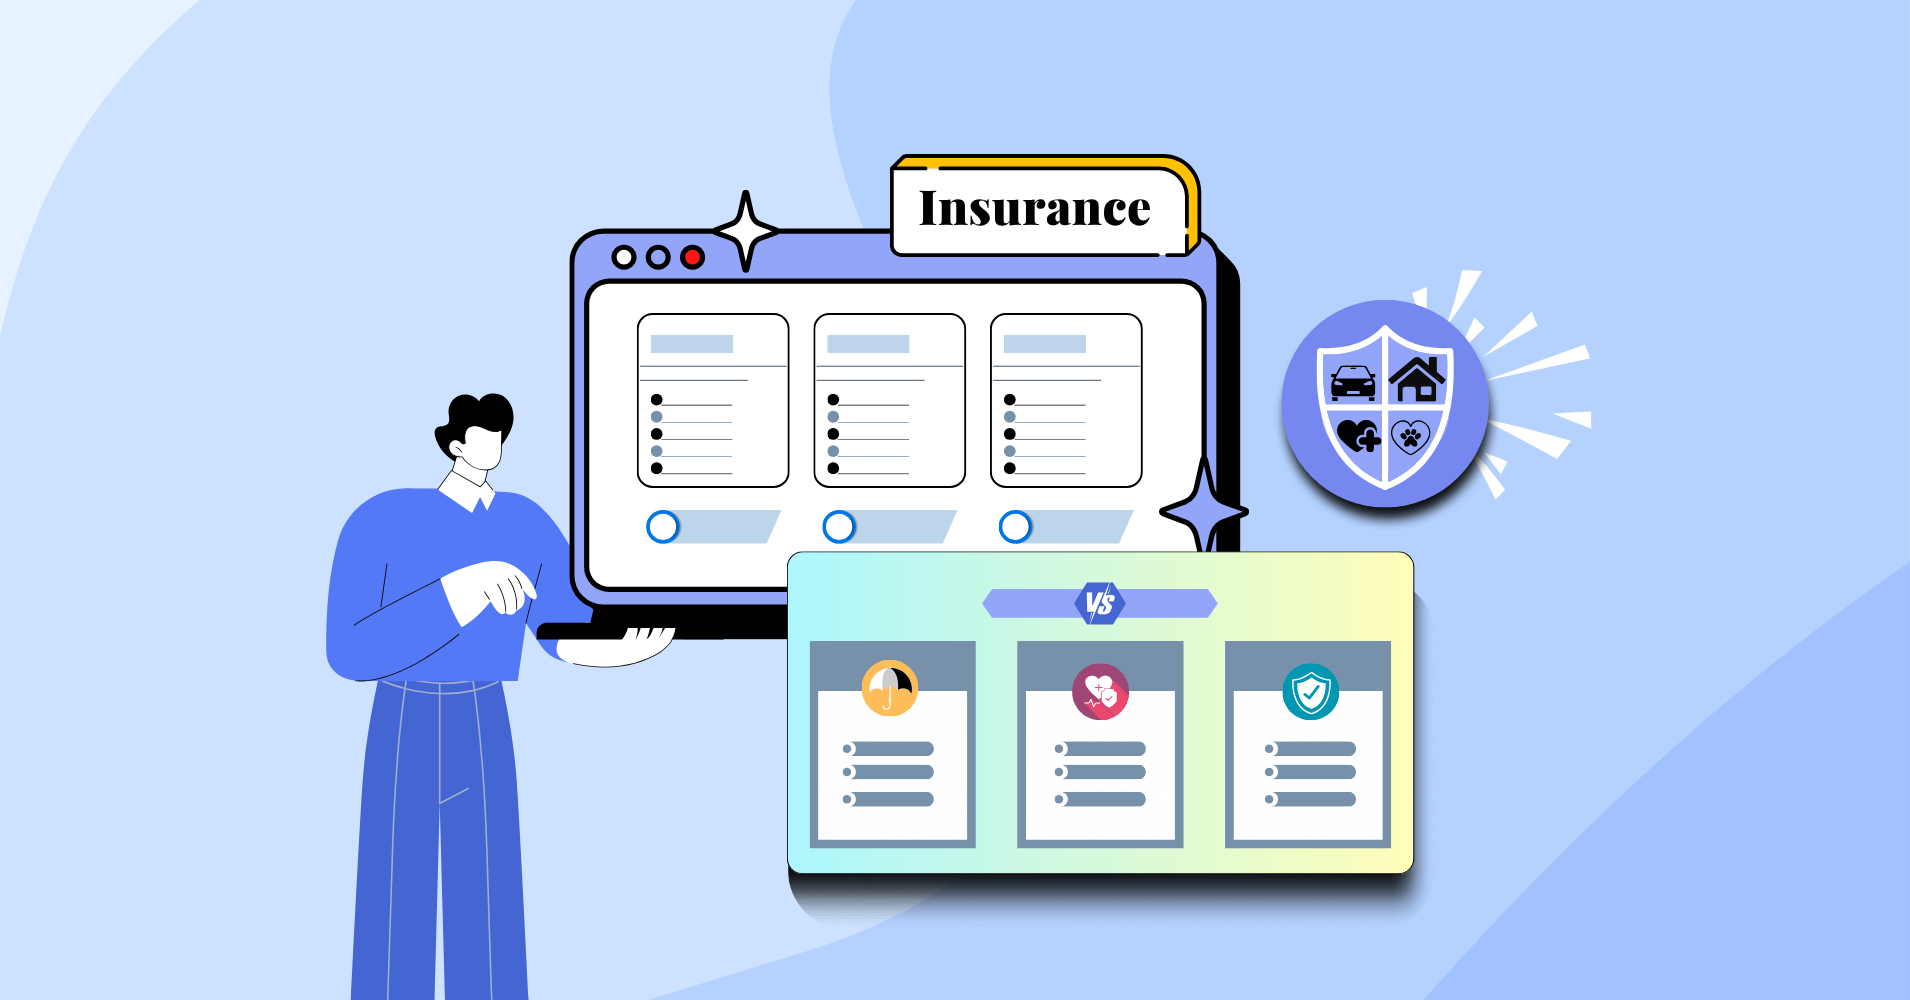
Design the Best Insurance Comparison Table
Insurance isn’t just about planning for worst-case scenarios – it’s people’s financial safety net. The right coverage protects families from unforeseen events. But here’s the problem: people still avoid reaching out to insurance providers like they’re dodging telemarketers. Why? One of the reasons is that complex terms, equations, quotes, and industry jargon make them uncomfortable!
When customers finally do reach out, they arrive overwhelmed and need their hand held through every basic detail. With limited staff and growing inquiries, companies struggle to provide personalized attention to every prospect.
What’s the solution? A strategically designed insurance comparison table gives people that basic, generalized view of the whole process before they take the big leap and start discussing personalized terms with the insurer.
Let’s explore how to build one that truly helps!
Why You Need Insurance Plan Comparison Table
Even without tailored quotes, a clear comparison table adds real value. Many people use insurance calculators to estimate deductibles or monthly premiums, not for purchases, but to get a ballpark figure. With that estimate in mind, they look for plans that align with it, then move on to get adjusted quotes. By showcasing your plan details upfront—even without customization—you attract informed prospects who are ready to decide. It also filters out unqualified leads and connects your insurance company with people who’ve already moved past the awareness and consideration stages of the decision-making process. Let’s see what else it can accelerate.
The trust factor
Modern consumers are skeptical of insurance sales tactics. They’ve been run down by hidden fees, industry jargon, math, and pushy sales approaches. Comparison tables smooth the process as they immediately signal transparency and build trust by
- Showing all options upfront – No hidden plans or surprise reveals
- Clear pricing visibility – Customers see exactly what they’ll pay
- Feature transparency – All benefits and limitations are displayed
- Competitive confidence – Shows you’re not afraid to be compared
Toolbox Pro | Aviva | Cover My Tools | |
Aug 2023 quote for standard vehicle and $5000 tools value | $184.81 | $130.70 | $264.94 (Includes DataTag marking system) |
Available as a standalone policy | (Qouted price depends on the purhcasing $2m public liability insurance @ $370) | ||
Limited to specified vehicle | (limited) | ||
Overnight cover | (parking restrictions apply) | ||
Away from home cover | (only 24hrs if unattended) | ||
Electronics covered (1 Business laptop and phone only) | (one device only) | ||
Standard excess | $100 | $250 | $200 |
Settlement deductions | (N.B any remaining installments due if premium paid monthly) | ||
Basis of valuation | (original purchase price paid) | (depreciated cost based) | (Replacement via insurers preferred supplier) |
Proof of forced entry required | (required) |
Courtesy of Ninja Tables
To explore more table templates like this for any other use cases, explore Ninja Tables free templates page.
Get table templates for free
WooCommerce
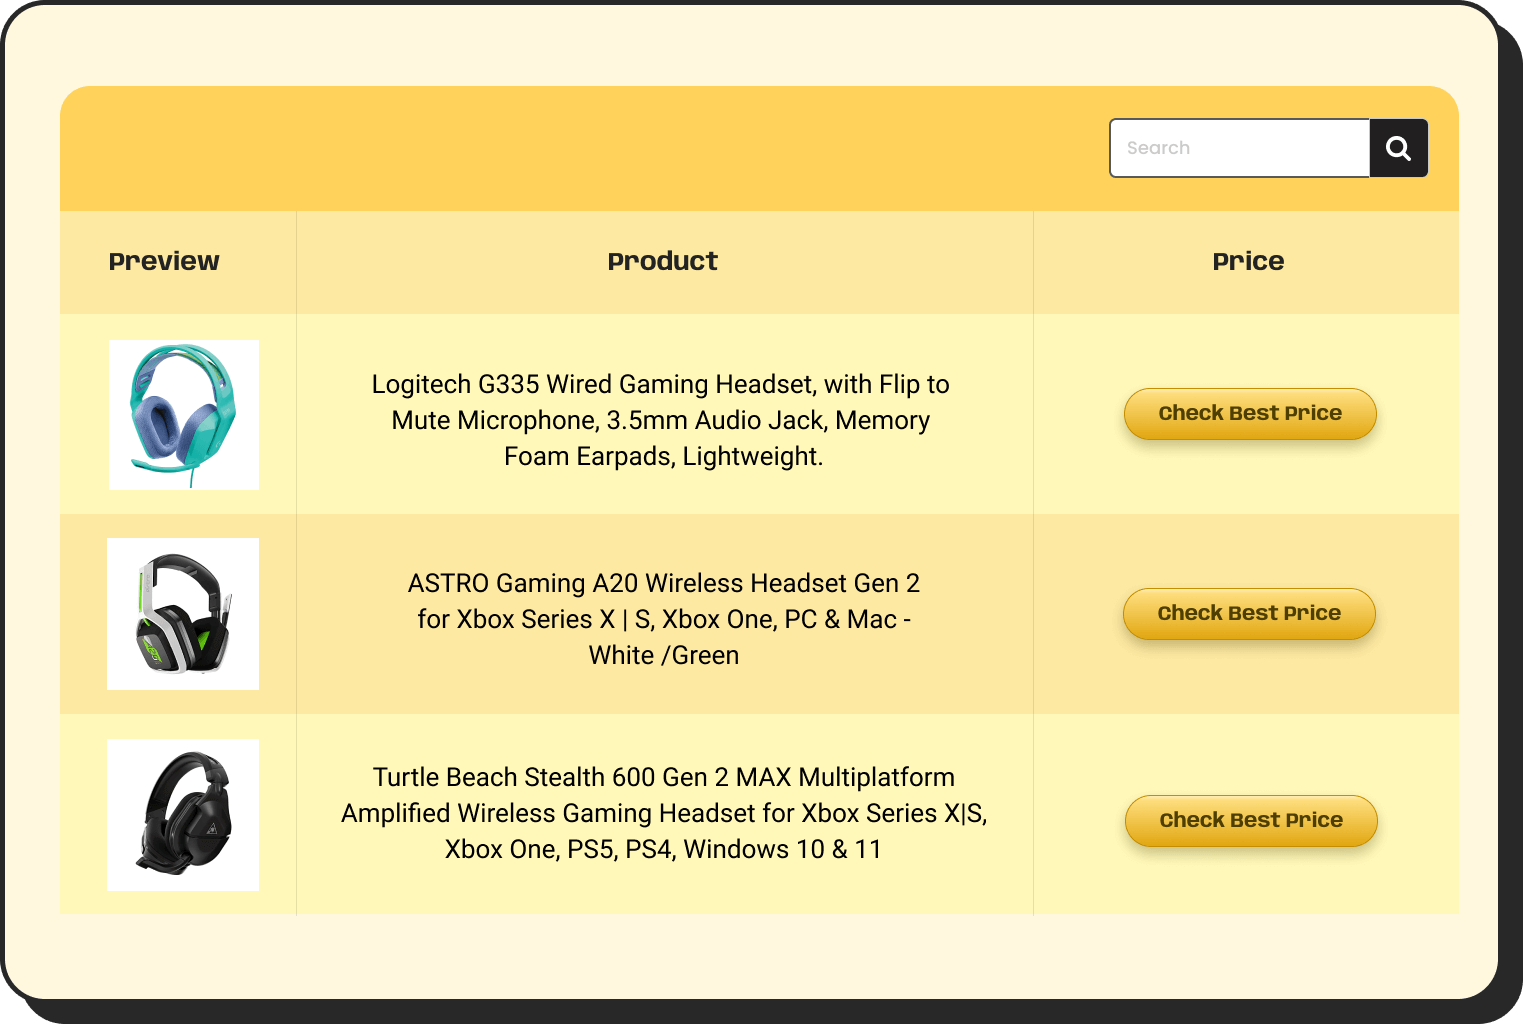
Amazon Products
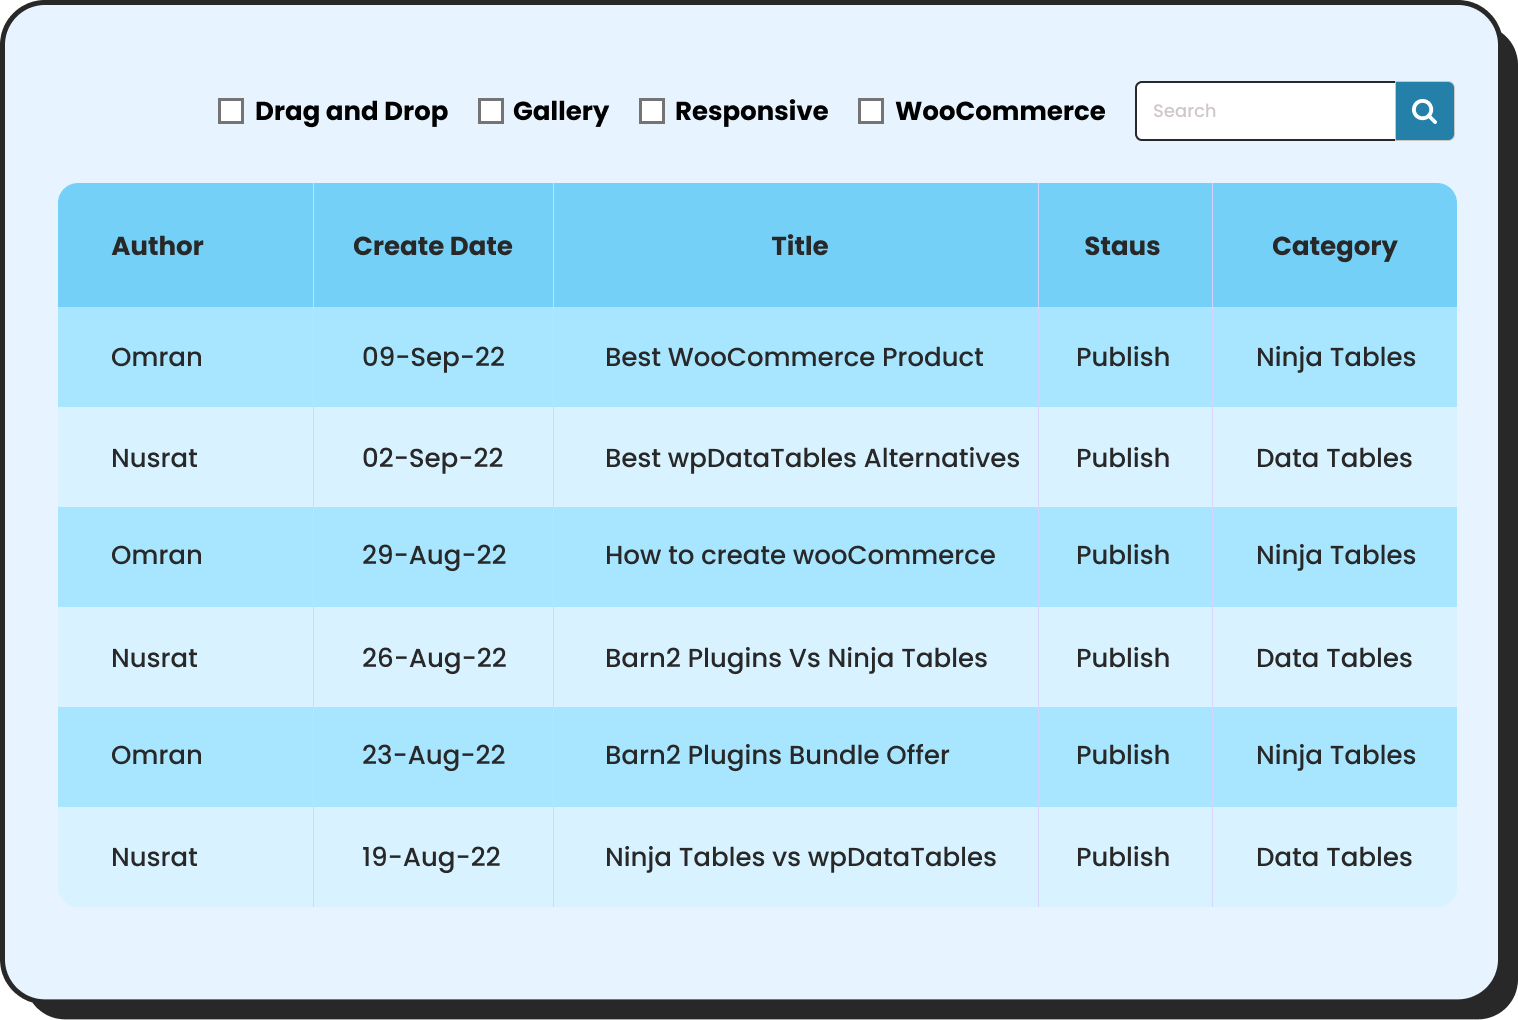
WP Posts
Products Comparison
Pricing Table
Features Comparison
Psychological decision-making
Comparison tables tap into how humans naturally make decisions. Show clearly what they’re missing out on by a simple yet informative insurance plan comparison table to generate intrigue. More on-
- Cognitive Load Reduction: Instead of remembering details across multiple pages, customers see everything at once.
- Social Proof Integration: Popular plans can be highlighted with badges like “Most Popular”, “Best Value”, “Customer review”, or “Claims paid”, etc.
- Loss Aversion Leverage: Customers can see what they miss by choosing lower-tier plans.
- Avoid industry jargon: Make it simple and easier to skim through using items like indicators (✅/❌, highlight, etc.).
Car Insurance Features | Basic Plan | Standard Plan | Premium Plan |
Third-Party Liability | |||
Accidental Damage Cover | |||
Vandalism or Theft Protection | |||
Arson Damage | |||
Personal Injury Protection | Add-on | Add-on | Included |
Depreciation Shield | |||
Engine Breakdown Cover | Optional Add-on | Included | |
Lost Key & Lock Replacement | Optional Add-on | Optional Add-on |
Read this detailed guide to learn more about comparison tables for products, services, and features.
Customers need clarity
Life insurance policies are notoriously confusing. When you present 3–5 plans side by side on a table, it:
- Reduces decision fatigue
- Helps users see the differences in premiums, coverage, term length, and other key factors.
- Builds confidence in their decision-making by seeing the general but ideal information.
- People stay longer on the site, bounce less, and are more likely to request a quote or sign up.
Real-world effect: For example, this car insurance comparison table can be used for any car dealership web store. How so? Many dealership flagship stores have an affiliate connection with many insurance companies, and they offer value pricing for those store customers. If you’re an insurance brand marketer, proudly showcase the extra tips, hacks for people to get the deal from your store. Here’s an example of such a car insurance comparison table-
2025 Plan | DriveSafe | TurboCover | AutoGuard | Velocity+ |
Honda Civic | $582 | $603 | $648 | $669 |
Toyota Corolla | $574 | $596 | $637 | $662 |
Chevrolet Malibu | $589 | $611 | $684 | $673 |
Subaru Outback | $603 | $627 | $684 | $650 |
BMW 3 Series | $712 | $745 | $684 | $829 |
BMW 3 Series | $712 | $745 | $684 | $829 |
BMW 3 Series | $712 | $745 | $684 | $829 |
Quote Details | ||||
Driver Quote Details | Coverage Details | |||
|
| |||
Trust-building
Insurance plan comparison that clearly outlines what’s offered—and what’s not—shows transparency.
- Hidden terms or vague plan info make users suspicious.
- A comparison table signals: “We have nothing to hide. Compare and decide.”

Need pro tips on how to best optimize every feature of Ninja Tables to make your own insurance plan comparison table? Read this instructional blog on comparison table best practices to boost customer experience.
For insurers: It boosts conversion
If you’re an insurer or agent, a comparison table is more than a helpful comparison tool—it’s a lead magnet. With the reduced ambiguity about the base plan, people come well-informed and in the last phase of the purchase process. Also-
- It shortens the conversation between the agent and customer.
- If embedded on your site, it acts as a self-service sales assistant.
Mobile behavior & fast decisions
Most insurance searches now start on mobile. Tables make it easier to scan and compare, especially with Ninja Tables. Its responsive feature supports any device type and screen size for viewers to scroll through anytime, anywhere!
When it’s not helpful
- If your package/plan catalog is not informative
- If the plans are extremely unstructured (where a table would oversimplify things)
- If your audience is advisors, not end customers
- If the comparison table is filled with industry jargon
- If it’s not responsive and accessible on all device types
- If the audience gets lost in the long list of texts, grids
- If there’s no specific highlight or colors to break the boring text
- If the design is too overwhelming and loss of readability
But even then, internal teams can still use comparison tables for training or sales scripts.
Examples of Insurance Comparison Table
Not all insurance is created equal, and neither are comparison tables. Whether it’s protecting your health, car, home, or next vacation, the right table helps users instantly see what matters most. Here are some industry-specific examples packed with insights (and a few surprising stats!).
Pet insurance comparison table
From Jan 2024 to 2025, pet services and vet costs rose by 5.9% (U.S. BLS). And one in five is in debt because of vet bills. Pet insurance searches have surged 80% over the last 3 years, with Googling terms like “best dog insurance” or “cheap cat insurance” every month. Americans now avoid substantial out-of-pocket expenses with pet insurance. But decision fatigue is real—people don’t want to compare pet insurance coverage across 10 different sites.
That’s where you come in with Ninja Tables at your disposal. Whether you’re a marketer for a vet clinic, a blogger like Canine Journal, or an affiliate marketer, the pet insurance plans comparison table gives you a ready-made resource that does what pet owners actually want: compare pricing, coverage, and claim speeds side by side.
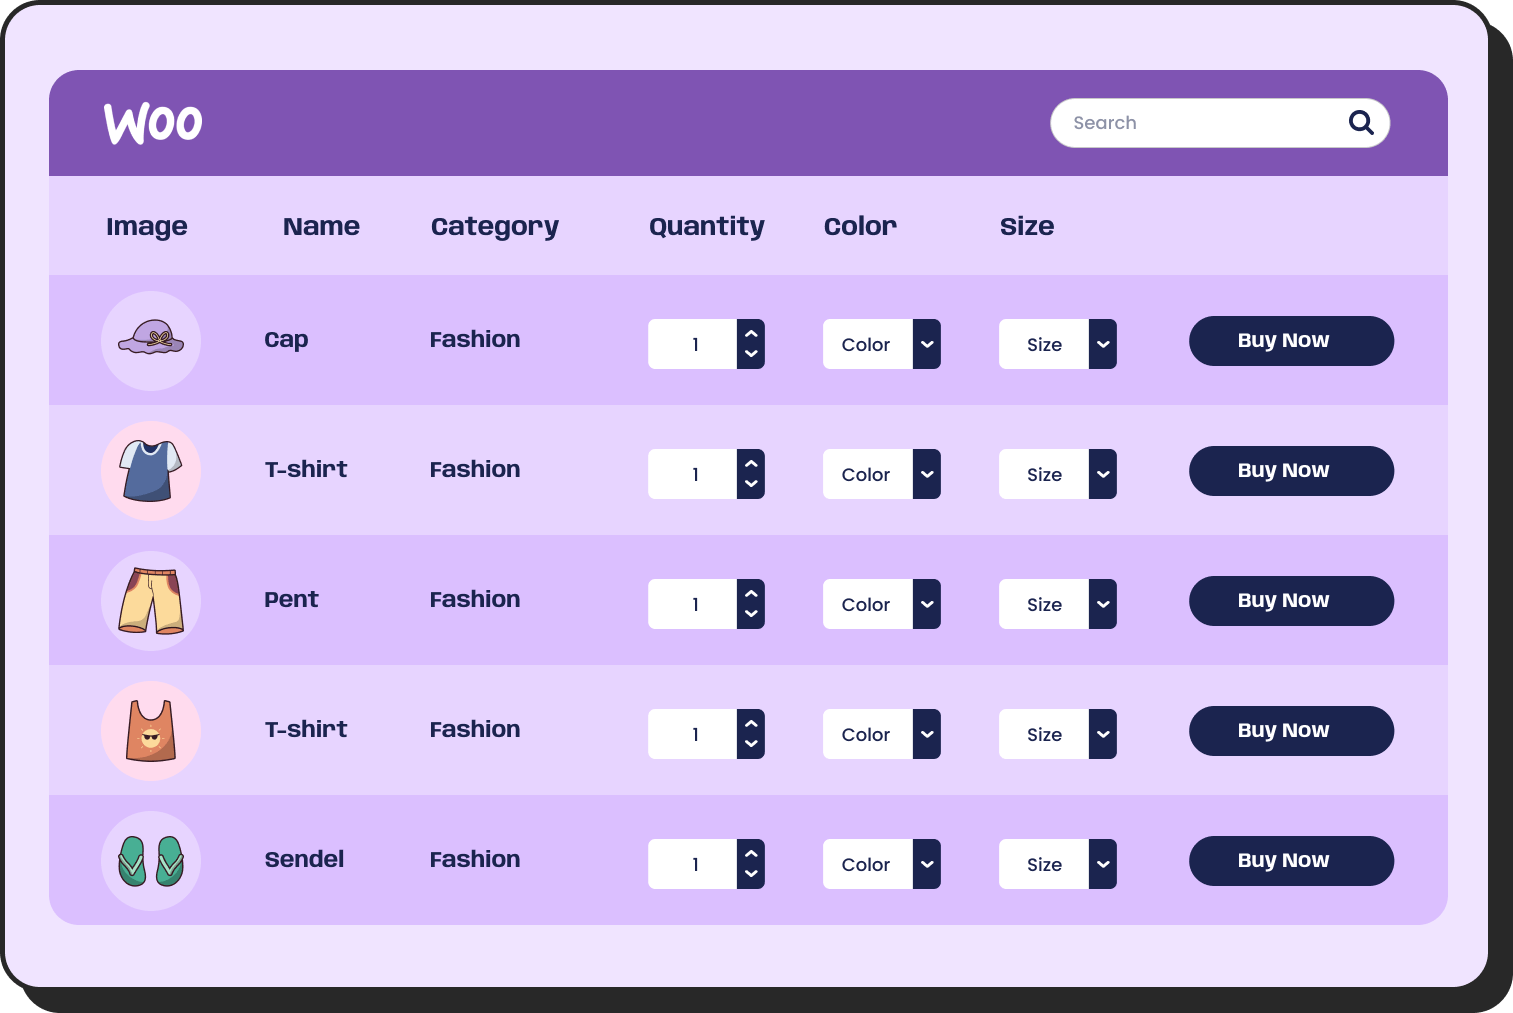
Real-world effect: For example, if you’re selling pet toys on your WooCommerce store, you can use Ninja Tables to neatly display your product list.
But why stop there? You can also offer added value to pet parents by sharing helpful resources, like tips for choosing affordable pet insurance. Create a curated comparison table that outlines the pros and cons of each brand, backed by specific stats and facts. With a clear side-by-side view of popular insurance policies from top providers, your table can guide users toward smarter, budget-friendly choices, all while reinforcing your brand as a trusted pet care resource.
Health insurance comparison table
With over 60% of U.S. bankruptcies linked to medical debt, clear health insurance comparisons are critical. A well-informed health insurance plan comparison table can help the general public. The cost comparison of health insurance plans in a table format usually breaks down coverage types, deductibles, and network hospitals to help users choose smartly.
Car insurance plans comparison
Did you know most drivers file a claim once every 18 years? Auto insurance tables compare coverage types, roadside help, accident coverage, and more, giving drivers a faster route to the best deal.
Company | Package | Prices | Claims Paid | Customer Review |
Click Cover | $185 | 93% | ||
Core Shield | $160 | 92% | ||
Term Sure | $182 | 79% | ||
Life Strong | $178 | 87% | ||
Shield Prime | $230 | 75% | ||
Term Ease | $219 | 81% |
Life insurance table
As life expectancy rises, so does interest in long-term coverage. Life insurance comparison tables typically display term lengths, required exams, and conversion options, enabling buyers to plan ahead with confidence.
 |  | ||
Term Coverage (20 years) | |||
Whole Life Option | |||
Accidental Death Benefit | |||
Critical Illness Rider | |||
Return of Premium | |||
Family Coverage Add-On | |||
Policy Loan Option | |||
Cash Value Growth | |||
24/7 Telehealth Access |
Aside from displaying a life insurance price comparison on your site, you can take it a step further by offering helpful breakdowns, such as a type of life insurance comparison table or a detailed cost comparison of life insurance plans. You can also guide users through essential topics, such as which policy best fits a working-class family, a young adult entering the market, or a retiree looking for an over-50s life insurance comparison. When people can view a life insurance plan benefits comparison, it helps them find the policy that truly fits their situation.
Features | Term Life Insurance | Whole Life Insurance | Universal Life Insurance | Variable Life Insurance |
Cost of policy coverage | Most affordable option | More expensive than term | More expensive than term | Most expensive among all types |
Medical exam required | Varies | |||
Coverage period | Fixed term (10–30 years) | Lifetime | Lifetime | Lifetime |
Premium payment schedule | Can vary | Typically fixed | Fixed | Fixed |
Accumulates cash value | ||||
Flexible death benefit | ||||
Investment component | N/A | Managed by insurer | Managed by insurer | Managed by policy holder |
Eligible for life settlement | Yes, with qualifications | Yes, with qualifications | Yes, with qualifications | Yes, with qualifications |
Withdraw or borrow funds |
Home insurance comparison
With 1 in 10 homes now at moderate to severe risk from natural disasters, homeowners want to know what’s covered. Tables help them weigh premiums, disaster coverage, and optional add-ons. By laying out coverage, premiums, and benefits side-by-side, you help customers grasp the value fast and engage with confidence.
Decision matrix comparison table
Ultimately, every piece of information you put out there will come down to this decision process. A decision matrix helps evaluate multiple options to make objective comparisons. Your target customer will identify the best choice based on weighted factors important to their specific situation. Add the last attraction by providing simple logistical metrics, link the social proofs, reviews, etc, so people can check what previous users think before jumping to the final decision.
Priority | Term Life | Whole Life | Universal Life | Variable Life |
Lowest Cost | ||||
Permanent Coverage | ||||
Cash Value Growth | ||||
Flexibility | ||||
Simplicity |
Disclaimer
This guide provides general information for educational purposes. Plan, pricing, or package examples are for illustrative purposes only, and actual costs may vary. Always consult with licensed insurance professionals and review actual policy documents before making decisions. And as insurers, customize these tables to best suit your offerings.
What a Comparison Table Does Before the Quote Stage
Before a customer ever clicks “Get a Quote,” a comparison table helps them understand, filter, and focus. It bridges the gap between browsing and taking action. More on this:
Qualifies the interest
It helps potential customers self-qualify:
- “This plan doesn’t fit my budget.”
- “I want one that includes accidental death.”
- “I don’t want a medical exam plan.”
This reduces wasted leads for insurers and filters people to the right plan before calculating a quote.
Improves plan understanding
Many people don’t know the difference between:
- Term vs. whole life
- $100k vs $500k coverage
- Riders like critical illness or waiver of premium
A table shows that visually. Even if they still talk to an agent, they come prepared.
Reduces friction
Without a table, users are stuck reading paragraphs or downloading brochures. That slows them down. A table removes the question:
“Which plan is right for me?” To→ “Okay, I see the difference now. I want Plan B, give me a quote.”
This increases quote form submissions and reduces support questions.
Helps teams too
Insurers and agents themselves often use comparison tables internally:
- For training
- In sales presentations
- On landing pages or at events
Even if the final plan is personalized, they start from structured base plans. The table maps those out.
So what’s its purpose?
Let’s say it like this-
A comparison table won’t close the sale, but it gets the customer 70% of the way there. It informs, qualifies, and prepares them to talk to you with intent.
While life insurance plans often require personalized quotes or agent consultations, a comparison table plays a key role long before that stage. It helps potential customers understand core offers—like coverage, monthly premium, term length, or added benefits—and quickly rule out plans that don’t fit their needs. So they enter the quote stage well-informed and confident. Think of it as the smart, structured nudge that gets them there faster.
It’s not a quote tool—it’s a conversion primer.
Why Use Ninja Tables as Insurance Comparison Tool
Ninja Tables is the perfect solution for insurance companies wanting to create professional, conversion-optimized comparison tables without technical complexity. Here’s why it’s ideal for insurance websites:
- WordPress plugin installation in minutes
- No coding is required for basic to pro customization
- Easy integration with mutli-media, hyperlink or any other data type
- Seamless integration with existing data systems like Google Sheets, Fluent Forms, etc.
- Mobile-responsive out of the box
- Free pre-made table templates
- Easy to embed just with a shortcode
- Unlimited data accessibility
- User role feature to share within the team, board, and more!
Final Thought
Yes, ultimately, people get a quote or speak to an agent, especially for life insurance, which often depends on age, health, and lifestyle. A comparison table still serves important upstream purposes in the decision journey.
It’s not just about the table—it’s about what the table solves: confusion, lack of trust, and slow decision-making. If your insurance offering involves multiple plans, tiers, or riders, a comparison table is essential.
Ninja Tables– Easiest Table Plugin in WordPress


Add your first comment to this post