
How To Design a Table the Right Way: Mastering Data Table Design

Picture this! You’re in a world brimming with data. Here numbers and information hold the key to unlocking valuable insights. There is significance in efficiently presenting data. That informs and engages the audience. This is where the skill of data table design comes into play.
Imagine table UI designs that tell stories with their layout, capturing attention at first glance. These are the tables that not only communicate information but also leave a lasting impression on the visitors.
Now you must ask, ‘How to Design a Table the Right Way?’
Prepare yourself as we embark on this quest to data table design guidelines that weave narratives, captivate audiences, and conquer the digital landscape.
Why table UI design matter?
When merely looked at, a data table shouldn’t be dressed up only to appeal to aesthetic senses. Nevertheless, a well-designed table can still be a work of art as long as complements the function.
So, Why the design of a table is important?
In the case of presenting a significant amount of data or a comprehensive list of items, good table UI design becomes an indispensable tool. This approach offers several advantages that greatly benefit users, allowing for clear and organized data visualization.
By implementing a well-designed table, information becomes more readable and easily digestible, ensuring a smooth and efficient user experience.
How to design a table the right way?
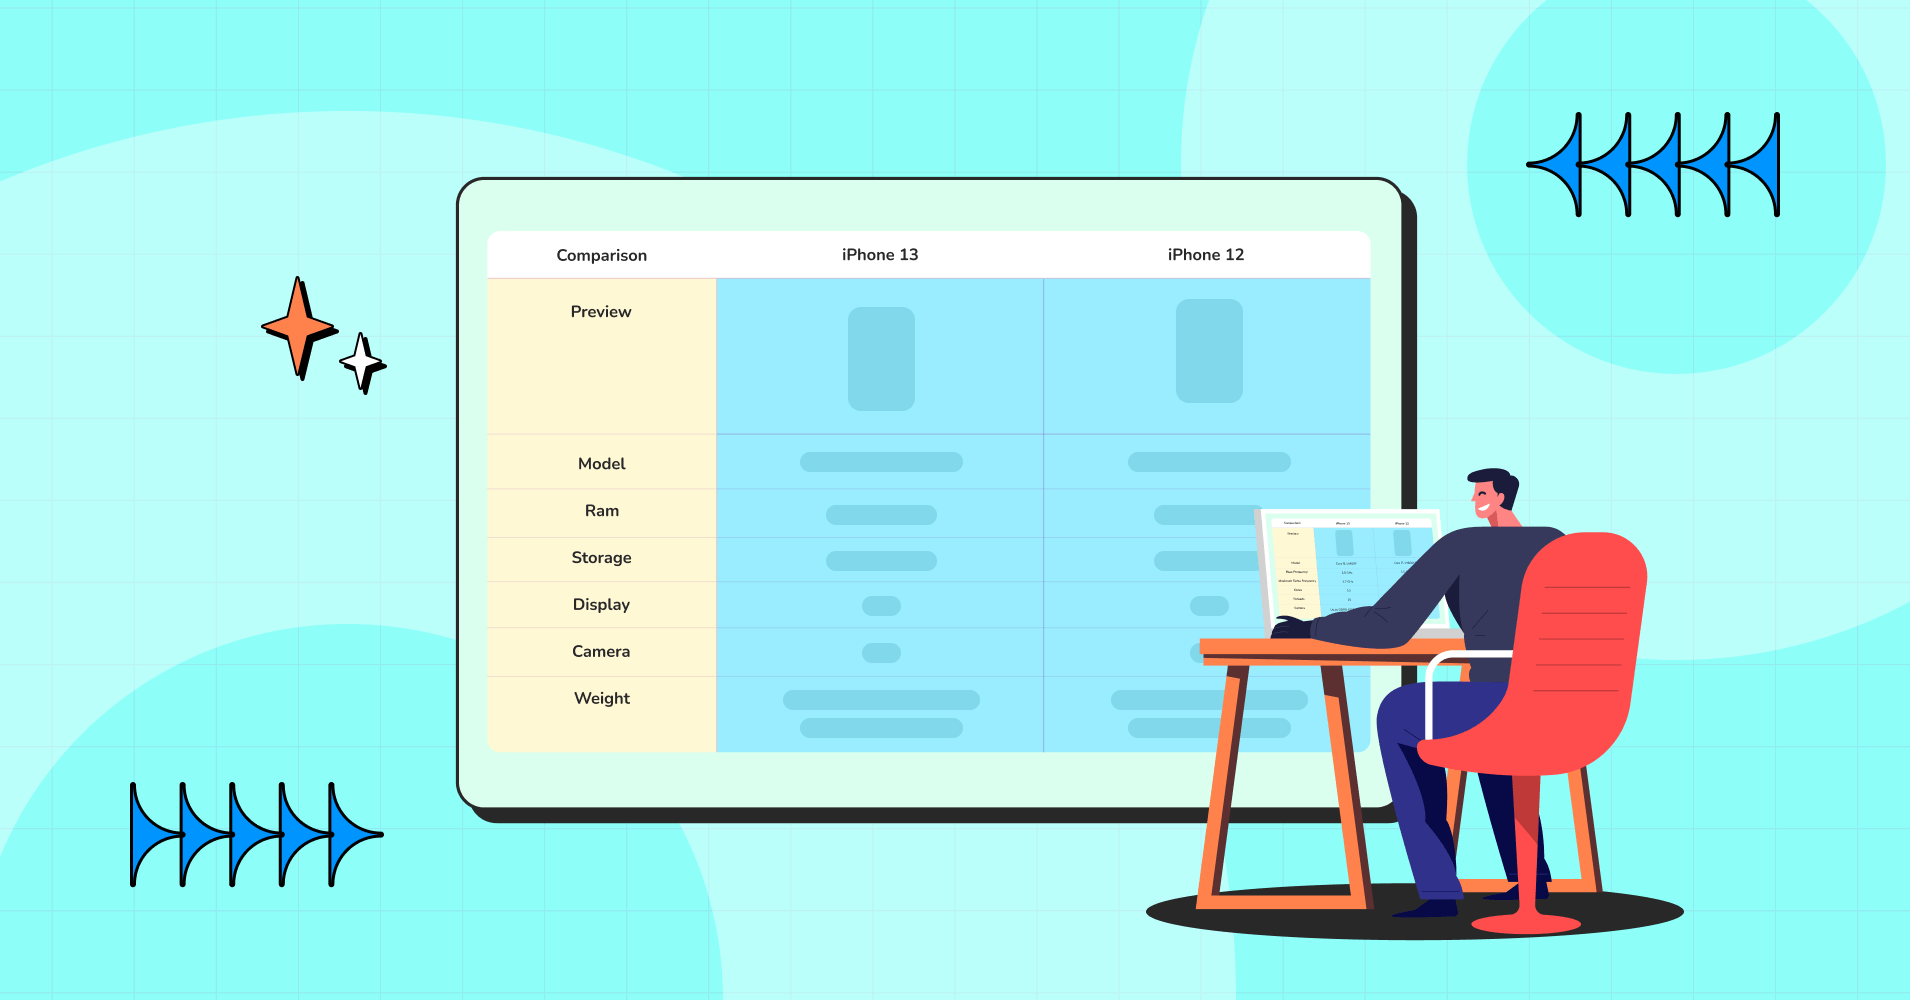
Tables are a great way to organize and present data. But the presentation will look cluttered and confusing to the user without a proper or, the right design.
They can be used to display information in a clear and concise way. They can help users quickly and easily find the information they are looking for. In order to be effective, tables need to be designed the right way.
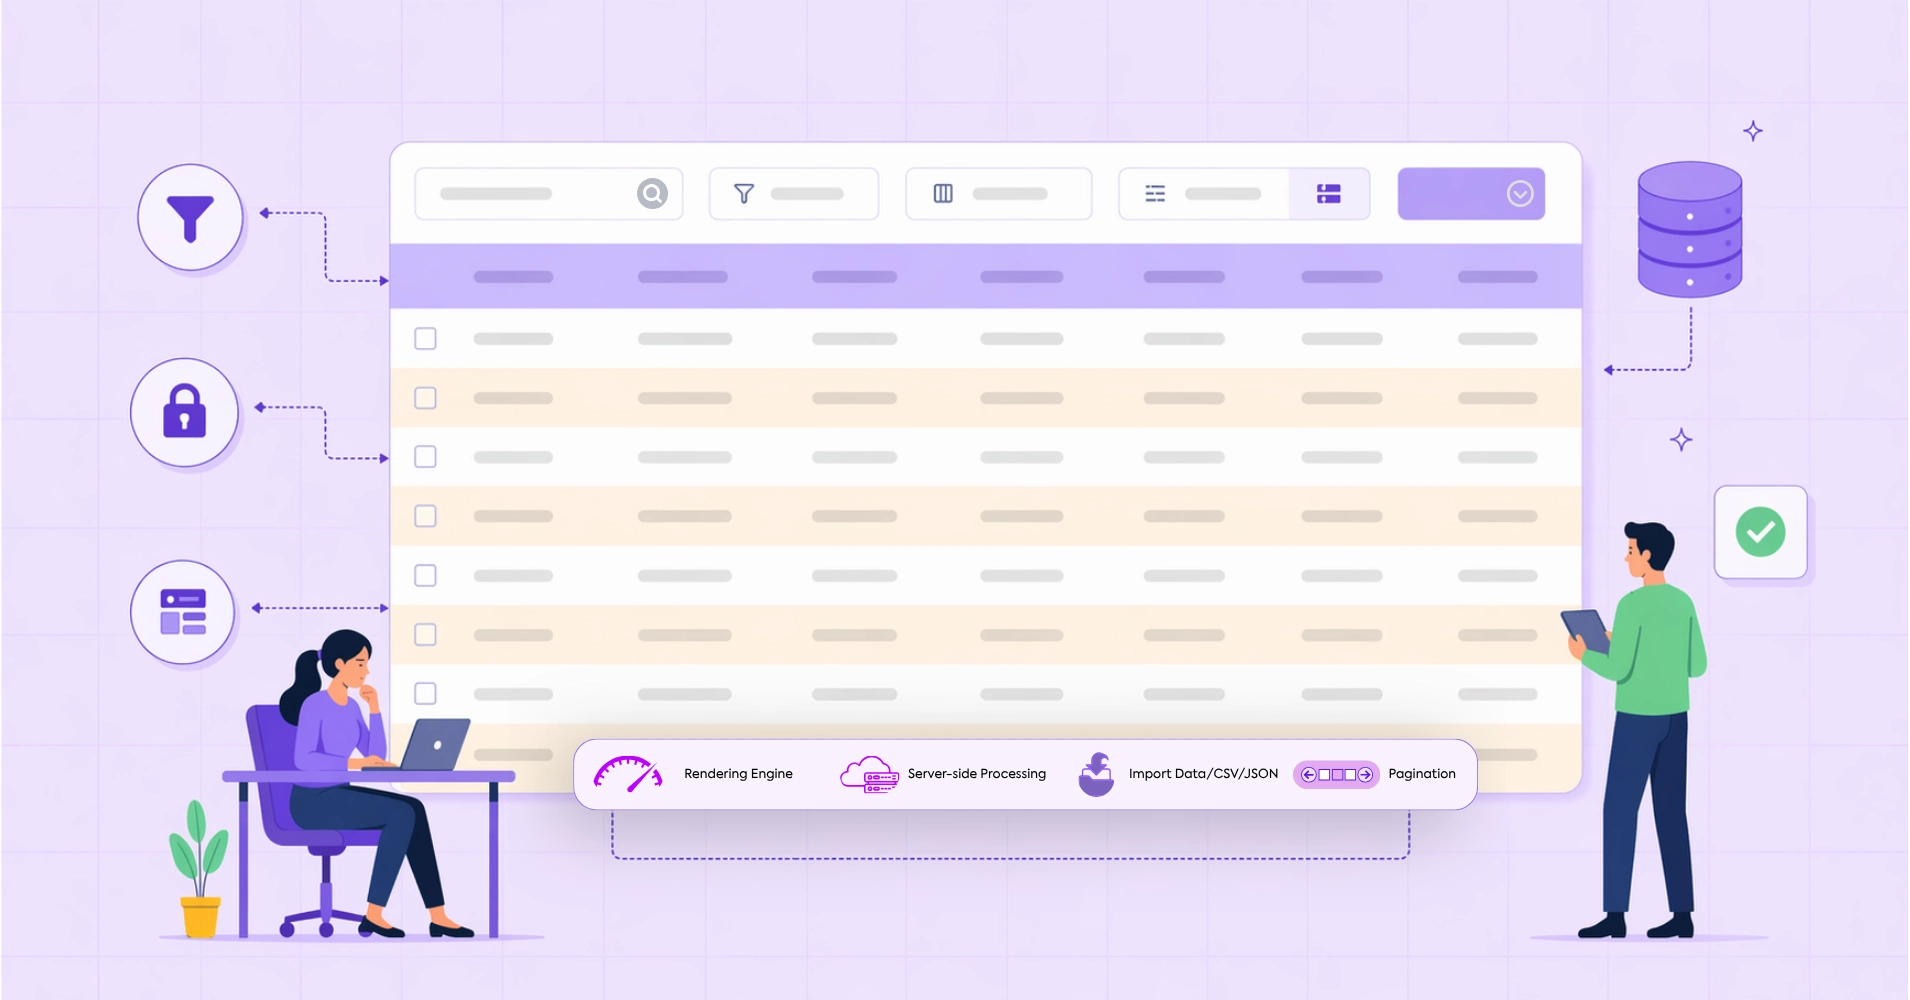
The ultimate guide to table UI design
In this section, we’ll review the fundamental principles of a good table design- user interface (UI), including striped rows, sorting, filtering, pagination, visual aesthetic, table style, and table functionality.
- Select the row style that perfectly complements your interface
- Unnecessary non-data elements should be omitted
- Do not over-style your table
- Allow users to select a row/column/cell
- Use suitable and readable fonts
- Allow users to expand the table
- Ensure proper data alignment and formatting of table headers
- Search and filter options to easily locate and sort through the data
- Merge multiple cells into one cell if the data are repetitive
- Consider narrowing (down) your columns
- Pagination for large data tables
- Use striped rows for clear contrast
- Table border or cell borders
- Put some consideration into how your table is sorted
- Proper font style and size
- Hover animation for interactivity
- Highlighting data you want to put emphasis on
- Data table colors (don’t make it a carnival though!)
Following these data table design best practices will make your text in the grid look appealing and easy to read.
What makes a good table design?
No matter how different a table’s size, complexity, contents, or purpose may be, all of them conform to the same two basic design tenets: they must be readable and provide the reader with an overview of the data.
Tables have an undeserved reputation for being difficult to create and customize because most of us don’t have coding skills. But Ninja Tables got you covered! It’s a powerful table builder that can help you to create beautiful and effective tables with 0 lines of code.
Here are some inspiring examples of a good table design by Ninja Tables to help you design tables the right way.
- Customize table style
- Table data alignment
- Table borders
- Allow search and filter data
- Use featured column
- Table background colors
- Configure stackable tables for mobile devices
- Breakpoints for responsive table design
- Conditional formatting
- Merge table cells
- Dynamic data table
- Hover animation
- Bulk Action by Ninja Tables
- Visualize table data with charts
Customize table style
Your audience can browse, read, and comprehend data more easily if the data table is styled properly.
Here’s how you can customize table styles in Ninja Tables:
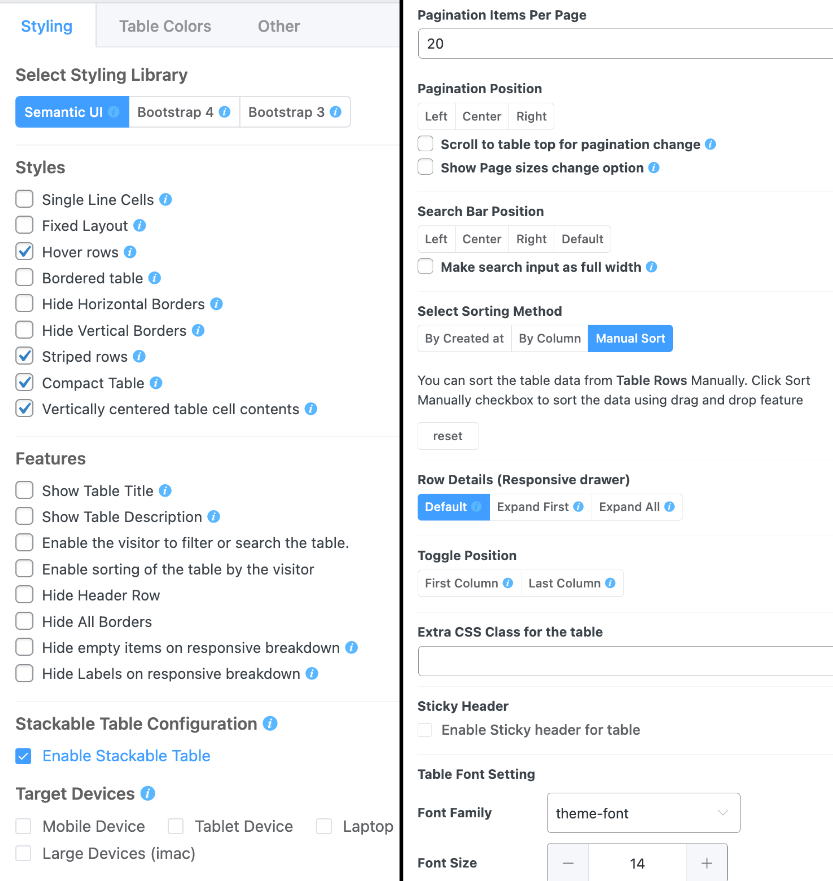
As you can see, there are 3 styling libraries and multiple options to pick your desired table style. From the “Styling” and “Other” tabs, you can-
- Enable row hover animation
- Customize table border, header, title, and description
- Enable stackable table
- Control pagination and search bar position
- Extra CSS
- Make header sticky and change data fonts
Table data alignment
Aligning table data in the center and leaving white spaces around makes it easier for the audience to focus on the data cell.
While doing this, make sure the header texts are center aligned as well.
Table borders
Ever seen a table without border? If the data is text-based, it probably doesn’t look that bad.
But a numeric data table requires table borders and row/column boundaries. It also separates the table header from table rows and columns. So, everything looks properly placed.
Enable or disable table borders to separate cells, rows, and columns.
Allow search and filter data
Filters and sorting can help users quickly and easily find the information they are looking for in your table. Make sure to include these options in your table.
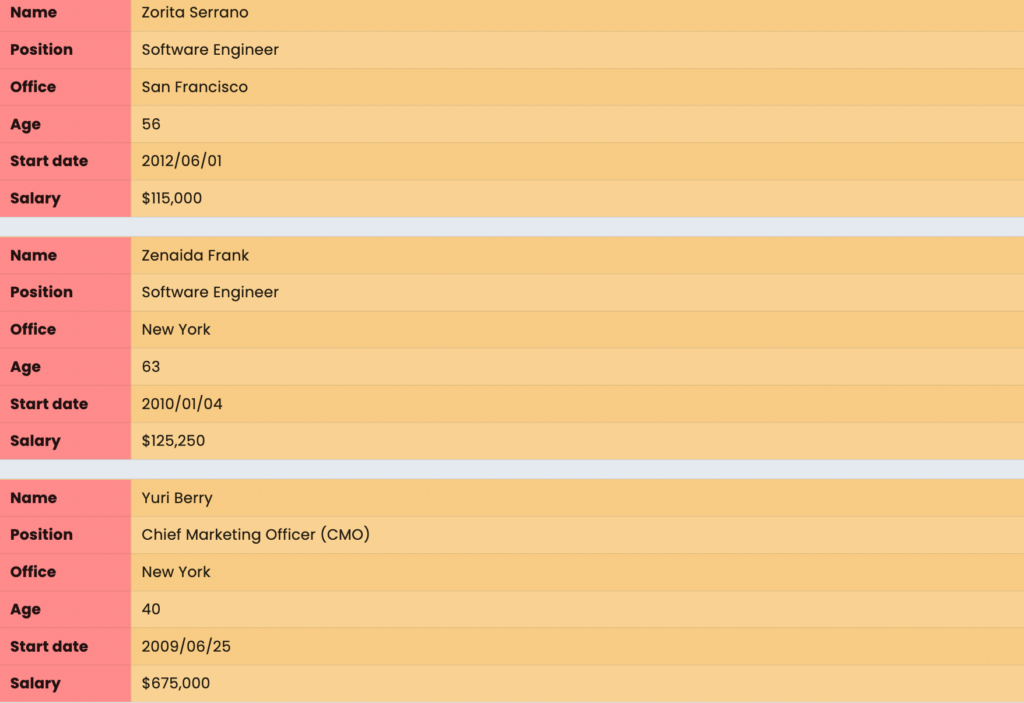
| Name | Position | Office | Age | Start date | Salary |
|---|---|---|---|---|---|
| Zorita Serrano | Software Engineer | San Francisco | 56 | 2012/06/01 | $115,000 |
| Zenaida Frank | Software Engineer | New York | 63 | 2010/01/04 | $125,250 |
| Yuri Berry | Chief Marketing Officer (CMO) | New York | 40 | 2009/06/25 | $675,000 |
| Vivian Harrell | Financial Controller | San Francisco | 62 | 2009/02/14 | $452,500 |
| Unity Butler | Marketing Designer | San Francisco | 47 | 2009/12/09 | $85,675 |
| Timothy Mooney | Office Manager | London | 37 | 2008/12/11 | $136,200 |
| Tiger Nixon | System Architect | Edinburgh | 61 | 2011/04/25 | $320,800 |
| Thor Walton | Developer | New York | 61 | 2013/08/11 | $98,540 |
| Tatyana Fitzpatrick | Regional Director | London | 19 | 2010/03/17 | $385,750 |
| Suki Burks | Developer | London | 53 | 2009/10/22 | $114,500 |
| Sonya Frost | Software Engineer | Edinburgh | 23 | 2008/12/13 | $103,600 |
| Shou Itou | Regional Marketing | Tokyo | 20 | 2011/08/14 | $163,000 |
| Shad Decker | Regional Director | Edinburgh | 51 | 2008/11/13 | $183,000 |
| Serge Baldwin | Data Coordinator | Singapore | 64 | 2012/04/09 | $138,575 |
| Sakura Yamamoto | Support Engineer | Tokyo | 37 | 2009/08/19 | $139,575 |
| Rhona Davidson | Integration Specialist | Tokyo | 55 | 2010/10/14 | $327,900 |
| Quinn Flynn | Support Lead | Edinburgh | 22 | 2013/03/03 | $342,000 |
| Prescott Bartlett | Technical Author | London | 27 | 2011/05/07 | $145,000 |
| Paul Byrd | Chief Financial Officer (CFO) | New York | 64 | 2010/06/09 | $725,000 |
| Olivia Liang | Support Engineer | Singapore | 64 | 2011/02/03 | $234,500 |
| Michelle House | Integration Specialist | Sidney | 37 | 2011/06/02 | $95,400 |
| Michael Silva | Marketing Designer | London | 66 | 2012/11/27 | $198,500 |
| Michael Bruce | Javascript Developer | Singapore | 29 | 2011/06/27 | $183,000 |
| Martena Mccray | Post-Sales support | Edinburgh | 46 | 2011/03/09 | $324,050 |
| Lael Greer | Systems Administrator | London | 21 | 2009/02/27 | $103,500 |
| Jonas Alexander | Developer | San Francisco | 30 | 2010/07/14 | $86,500 |
| Jennifer Chang | Regional Director | Singapore | 28 | 2010/11/14 | $357,650 |
| Jennifer Acosta | Junior Javascript Developer | Edinburgh | 43 | 2013/02/01 | $75,650 |
| Jenette Caldwell | Development Lead | New York | 30 | 2011/09/03 | $345,000 |
| Jena Gaines | Office Manager | London | 30 | 2008/12/19 | $90,560 |
Use featured column
Identify the most critical information within your data table that you want to draw attention to.
Improving the overall visual hierarchy of the table enhances user experience and engagement. It helps to design better data tables while increasing the likelihood of data retention and understanding.
For example, a pricing table with a tier pricing system where you want people to focus on the column in the middle. Simply highlight it and make it larger to create the illusion of the “best price.”
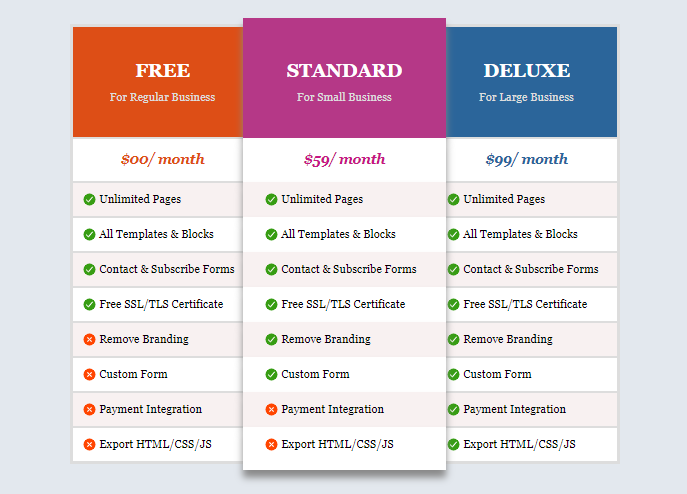
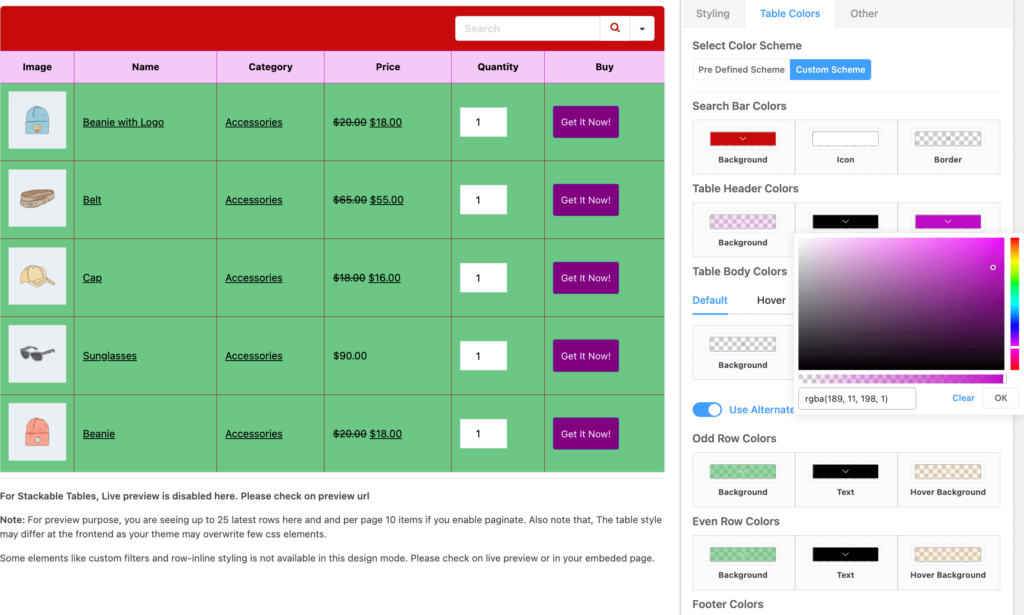
Table background colors
Talk about appeal and aesthetics and we come with coloring table cells, backgrounds, and all things customizable with pretty colors!
Use colors on your data table smartly. For example, separating the header and table body with two different colors.
Ninja Tables design and coloring panel can help you pick the perfect color for your table and you can view it in real-time.
Configure stackable tables for mobile devices
Let’s face it. You can’t overlook the huge group of people who are more comfortable using their mobile phones than desktops.
So, your data table needs to appear nicely, without swiping left/right to see the columns that don’t fit on a small screen. Check out Ninja Table’s stackable option.
Enable “Stackable Table Configuration” and customize for mobile devices to turn each row into smaller tables.
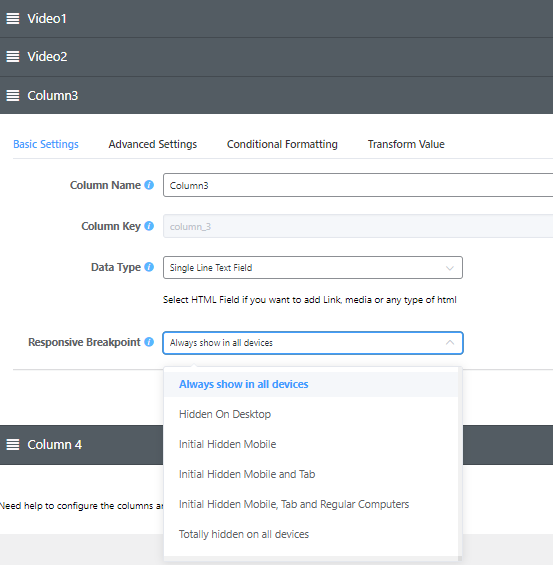
Breakpoints for responsive table design
In Ninja Tables, you can choose what column you want to show on what device.
Hide a column for the desktop and the desktop users will see a “+” sign on the front-end. If they click the “+” sign, the hidden column will appear.
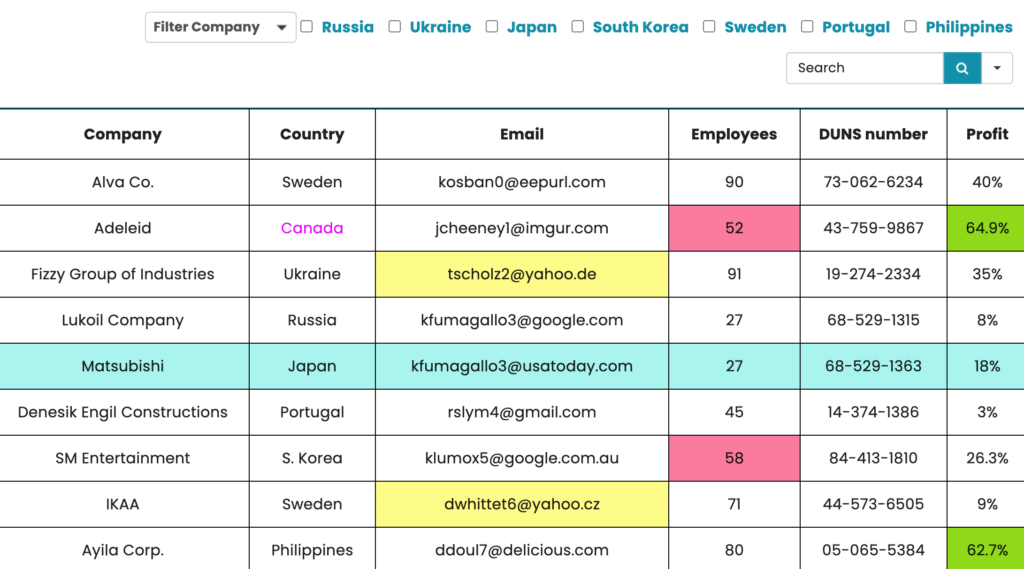
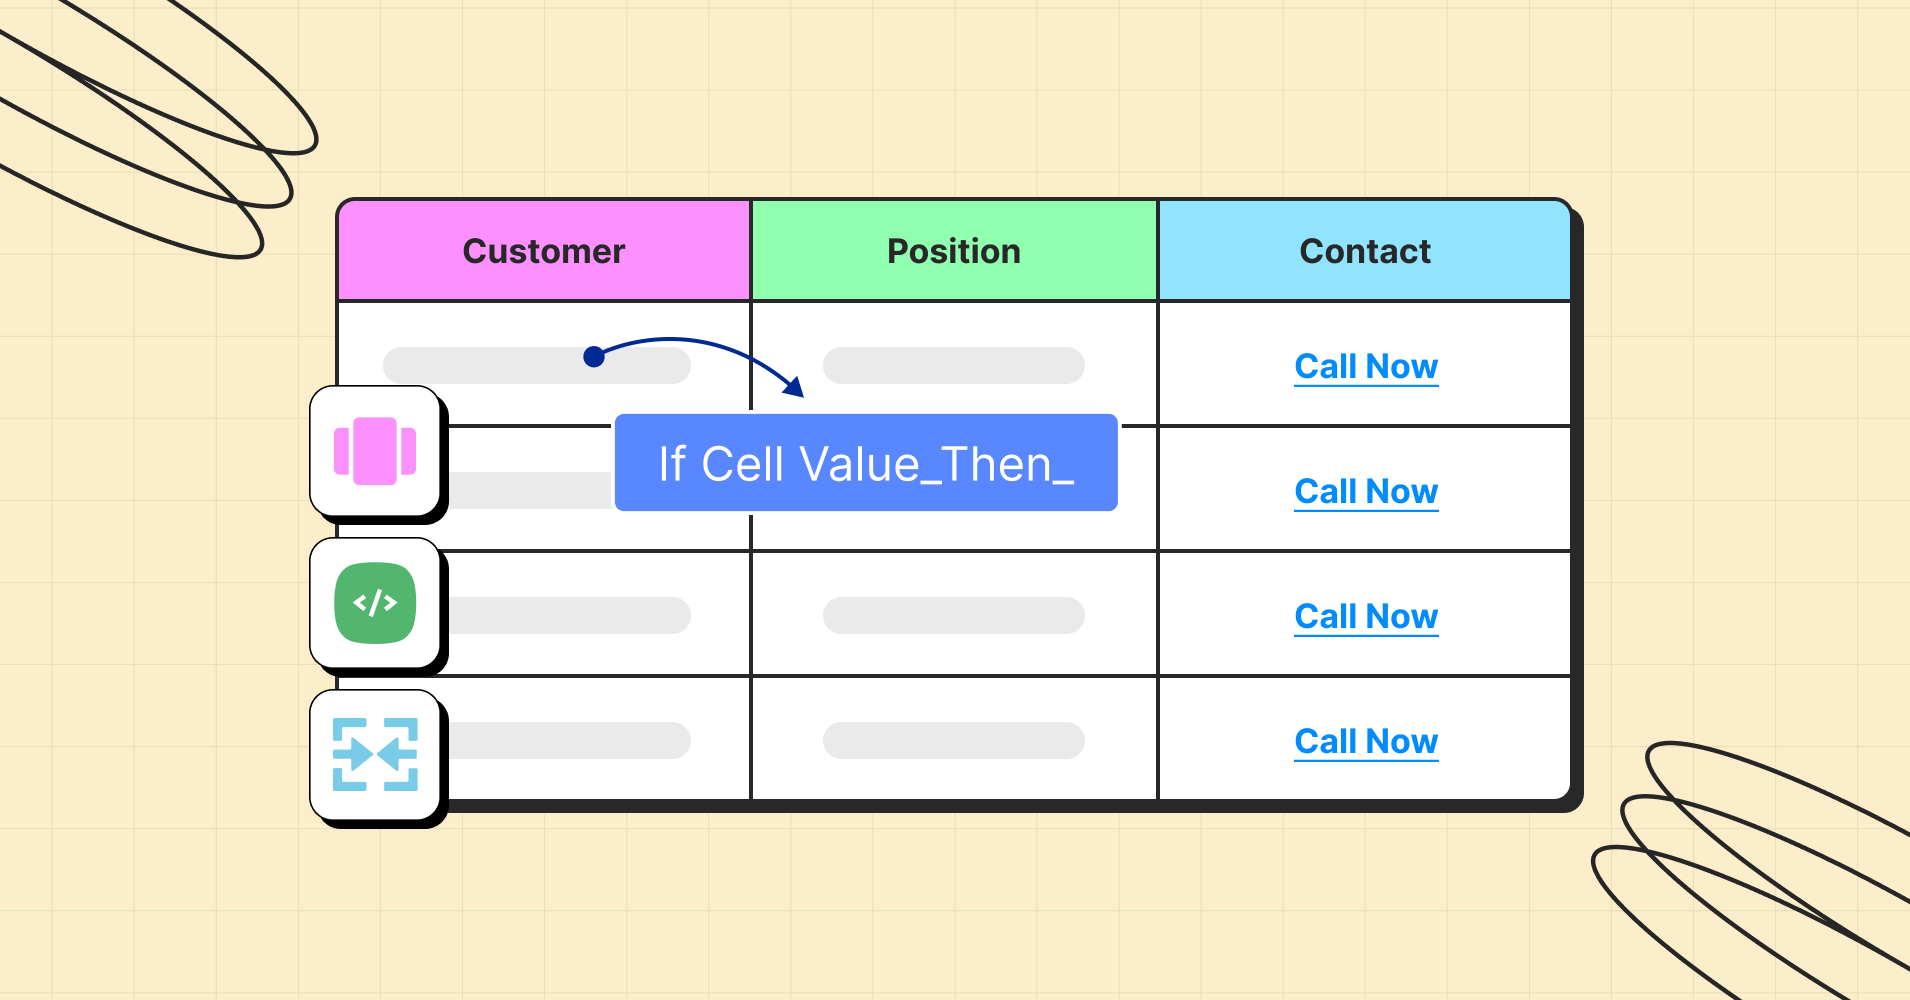
Conditional formatting
It’s hard to quickly find information, particularly, numeric values in a large set of data cells and columns. Just imagine, you need to quickly find multiple vendor orders/shipments in metric ton ratio such as 10-20 for a specific year.
Apply conditions that correspond to cell values.
Ninja Table easily lets you highlight or change cell content reacting to a specified condition.
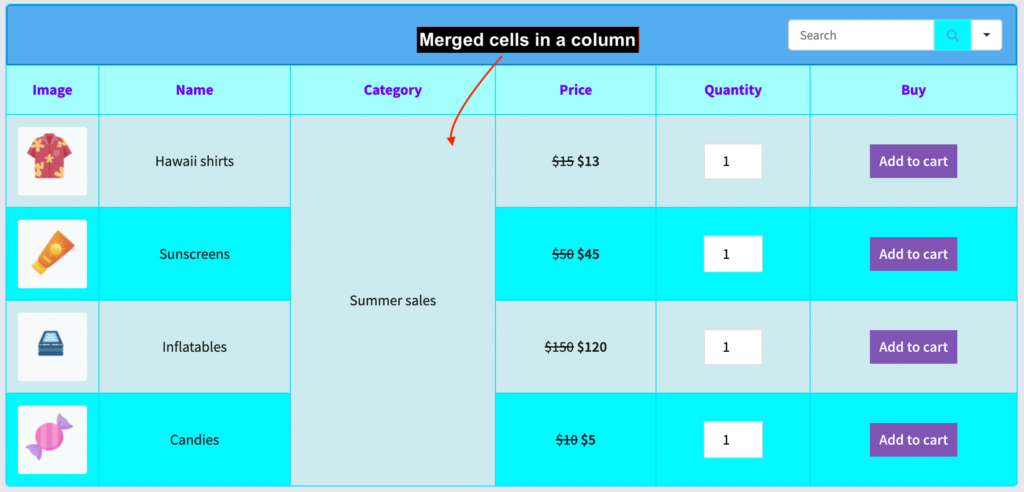
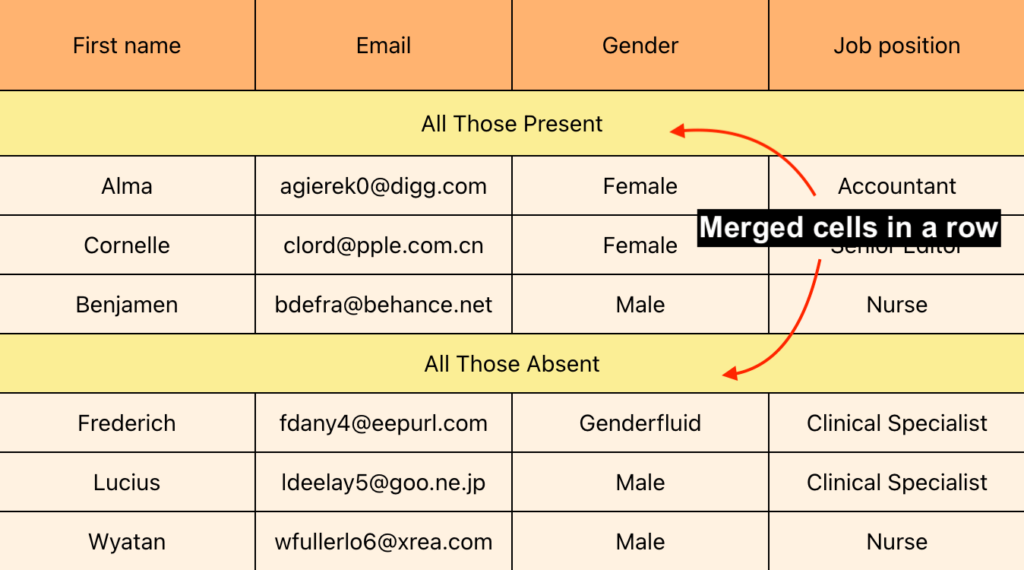
Merge table cells
If a data table has multiple identical data in consecutive cells, you might wanna try merging those cells into one big cell.
This way, your audience won’t get bored reading the same word more than twice. It’s just another advantage of using a table instead of long paragraphs!
Dynamic data table
A table is only required when it can showcase all types of dynamic data that will take up a big chunk of space as a paragraph.
Add dynamic elements like buttons, links, or multimedia to design a stunning table.
- A table with multiple columns can present multiple data types
- You can add icons, links, a rating system, etc. to make UX more pleasant
- Actionable buttons also help to create a good impression
- A better media visualization option using the lightbox feature enhances the UI
- Show necessary links, download option, or embed videos
- Make tables interactive with checkboxes or radio buttons
A table’s design not only depends on its layout but also on the data it presents.
Make the tables appear smart and informative with dynamic data visualization.
Hover animation
Interactive data tables are more popular than static tables. Add hover animation to your table rows for cool visual relief.
| Component | Specification |
|---|---|
| CPU | 800 MHz 1 Core ARM v6 |
| GPU | Adreno 200 |
| Chipset | Qualcomm MSM7227 |
| Memory | 278.34 MB |
| ROM | 178.39 MB |
| Network Data | 2G/ 3G / HSDPA 7.2 |
| OS | Android 2.3.7 |
| Screen Size | 3.5 inch |
| Resolution | HVGA (480*320) ~165 ppi pixel density |
| Shot Mode | Single/ Smile / Continuous / Panorama |
| Image |  |
| Mode Name | galaxy s9 plus |
| Brand Name | Samsung |
Enabling hover animation can turn every boring table fun!
Bulk Action
Enable users to pick and alter several things at once. Common actions become available at the top of the table once the rows have been chosen. By grouping together repetitive processes, this functionality can help users save a lot of time.
Visualize table data with charts
You can create much more than just data tables with this plugin.
Create horizontal charts, line charts, or even pie charts for better visualizing your business purpose such as internal progress, and comparison for monthly inflow or outflow.
Ninja Charts is a free chart addon that turns all your table data into stylish WordPress charts within a minute!
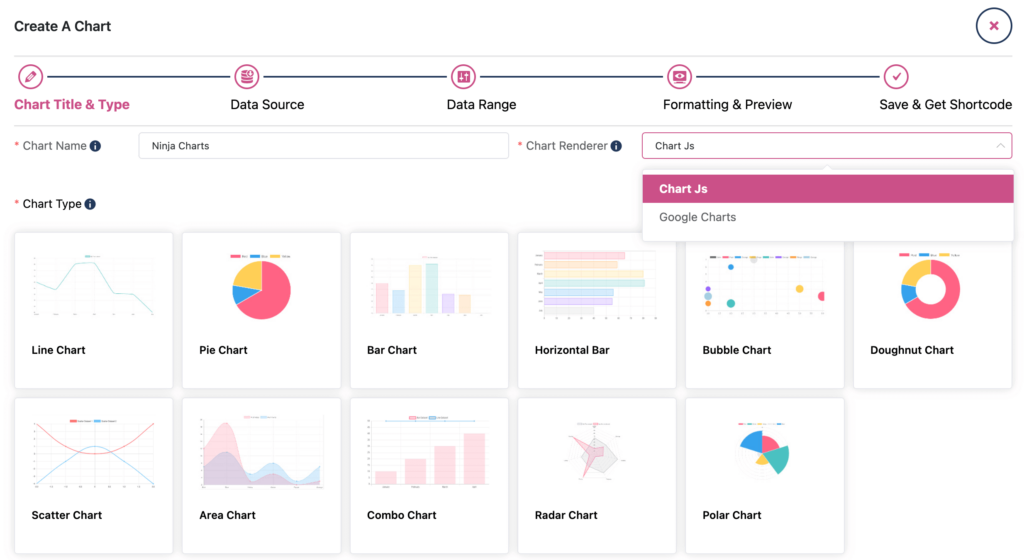
Table design template
Designing a data table requires time. A table plugin like Ninja Tables saves your time and energy. Creating tables manually with this plugin is easy, but the free table templates makes it a lot easier!
Choose a template and download the JSON file if you like the design. You can customize it further once you embed, of course!
Conclusion
There’s no way around the need to invest in a quality data table if you want to showcase all your dynamic data better.
Designing useful data tables that offer users value and utility is easier said than done, but it is fully possible with the right tool.
The tips and examples by Ninja Tables in this post will inspire you to produce fantastic work of your own.
Your creative instinct and access to Ninja Tables Pro is the only next big step you need to grasp all the professional design hacks to design the data table the right way!
Ninja Tables– Easiest Table Plugin in WordPress


Add your first comment to this post