Annual Income Table
Wednesday, January 28, 2025 Annual Income | ||||
Item A | Item B | Item C | Change | |
The First Quarter | $8234 | $6694 | $2405 | 50% |
The Second Quarter | $10976 | $8846 | $1263 | 50% |
The Third Quarter | $9937 | $10498 | $5367 | 30% |
The Fourth Quarter | $13450 | $12729 | $8185 | -10% |
The Annual Income Table summarizes earnings for individuals over a fiscal year, detailing sources of income, deductions, and net profits. It serves as a financial reference for individuals, businesses, and tax authorities to track income trends, assess financial health, and ensure compliance with tax regulations.
Use this table to track annual income information of your organization. Tracking these figures aids in strategic planning and financial decision-making.
How to use this table:
This table is easy to use and customize. Just follow these steps:
- Install and activate Ninja Tables on your WordPress dashboard.
- Go to Ninja Tables → Tables → Import Table.
- Select the JSON file and in the import format section choose: JSON/CSV- Exported From Drag-and-Drop Tables.
- Click on the Import button and wait for the confirmation message.
After getting the success message, you can edit your table as you wish. Add or remove columns, rows, and features. Change the colors, fonts, and styles.
When you are done, save your table and copy the shortcode to your clipboard. You can paste it on any page or post where you want to display the table. Enjoy!
***This table may include some Pro features. Get Ninja Tables Pro for all-access fun!
You May Also Like
-
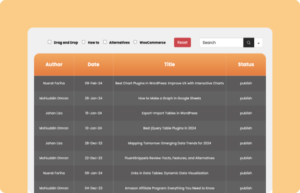
WP Posts Table
WordPress posts, pages, author, etc. can be shown in a WP Posts table.
-
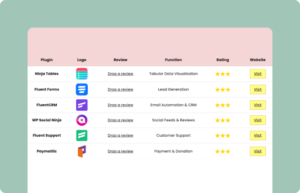
Website Review Table
Use this website review table to showcase your website fun facts
-
Report Card
Students’ report cards displayed in tables look clean and organized.

Craft Responsive Data Tables Fast!
Ninja Tables is the best table plugin to show data in an organized table format.

