Financial Projection Table
2026 | 2027 | ||||||
Jan | Feb | Mar | Q2 | Q3 | Q4 | FY | |
Cumulative seats | 0 | 0 | 61 | 594 | 1240 | 2117 | $822 |
End of period | $0 | $0 | $13 | $121 | $464 | $2039 | $850 |
Growth % | 0% | 0% | 282% | 339% | |||
Revenue* | $0 | $9 | $15 | $64 | $133 | $345 | $566 |
Cost of sales* | $1 | $3 | $3 | $31 | $45 | $72 | $15 |
Gross profit* | -$1 | $7 | $11 | $33 | $88 | $273 | $411 |
Gross margin % | 51% | 66% | 79% | 73% | |||
Earning before interest & tax | -$29 | -$29 | -$31 | -$152 | -$195 | -$54 | -$491 |
Financial plan | www.weekly.io | 523-345-7842 | |||||
A Financial Projection Table is vital for forecasting future financial performance and setting realistic expectations. It allows businesses to model various scenarios, plan budgets, and anticipate cash flow needs, which are crucial for long-term financial health and strategy.
The use cases of a Financial Projection Table include securing funding from investors by demonstrating potential growth, guiding managerial decisions on expenditures and investments, and providing stakeholders with a transparent outlook on the company’s financial future. It’s an essential tool for strategic planning and risk management.
How to use this table:
This table is easy to use and customize. Just follow these steps:
- Install and activate Ninja Tables on your WordPress dashboard.
- Go to Ninja Tables → Tables → Import Table.
- Select the JSON file and in the import format section choose: JSON/CSV- Exported From Drag-and-Drop Tables.
- Click on the Import button and wait for the confirmation message.
After getting the success message, you can edit your table as you wish. Add or remove columns, rows, and features. Change the colors, fonts, and styles.
When you are done, save your table and copy the shortcode to your clipboard. You can paste it on any page or post where you want to display the table. Enjoy!
***This table may include some Pro features. Get Ninja Tables Pro for all-access fun!
You May Also Like
-
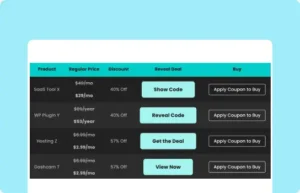
Click-to-Reveal Coupon
Initially hide coupon code or discount code to encourage clicks from people.
-
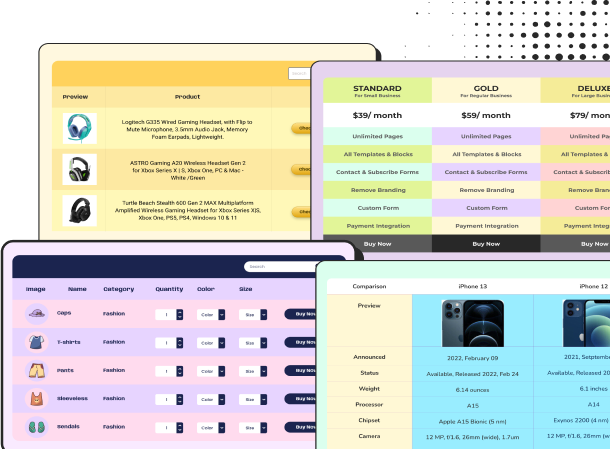
Product Display Box
Simple product display table with image, buy button, ratings, and description.
-
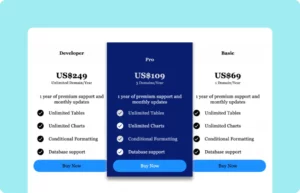
wpDataTables Pricing Table
Customize this pricing table to get a table like wpDataTables
Craft Responsive Data Tables Fast!
Ninja Tables is the best table plugin to show data in an organized table format.


