KPI Reporting Table
| KPI Category | Metric | Target | Current | % Achieved | Status | Notes |
|---|---|---|---|---|---|---|
| Traffic & SEO | Total Website Visitors | 100,000 | 78,560 | 78.60% | Below | Needs stronger SEO/content push |
| Organic Traffic Share | 60% | 52% | 86.70% | At Risk | Optimize blog & backlinks | |
| Bounce Rate | ≤ 45% | 50.20% | N/A | Below | Improve landing UX | |
| Leads & Conversions | Lead Conversion Rate | 4.50% | 3.80% | 84.40% | At Risk | Test better CTAs/forms |
| Total Leads Captured | 1,500 | 1,320 | 88% | At Risk | Promote lead magnets | |
| Sales Metrics | Qualified Leads | 1,000 | 900 | 90% | At Risk | Better CRM follow-up |
| Closed Deals | 300 | 265 | 88.30% | At Risk | Deal stage review needed | |
| Monthly Recurring Revenue (MRR) | $30,000 | $33,200 | 110.70% | On Track | Great! Expand client pipeline | |
| Customer Success | Customer Satisfaction Score (CSAT) | 90% | 94.20% | 104.60% | On Track | Strong account management |
| Net Promoter Score (NPS) | 70 | 66 | 94.30% | At Risk | Follow up on detractors | |
| Operations | Average Response Time (support) | ≤ 2 hrs | 1.8 hrs | N/A | On Track | Efficient support |
| Project Delivery Rate (on-time %) | 95% | 91% | 95.80% | On Track | Just keep tracking |
KPIs are the must-watch numbers that tell you how your business is really doing. And analyzing those unstructured kpi metrics is like reading a map without labels—you have the data, but no clear direction. A KPI reporting table simplifies complex information using grids, color coding, and advance filters, making it easier to interpret. But why a table? This format highlights what truly matters, helping you focus on strategic priorities while minimizing distractions.
KPI measurement lays the foundation for strategic improvements—from ecommerce brand reform to tracking brand awareness. Use kpi to measure marketing campaign, track progress, analyze visibility with SEO kpi reports, assess team output using kpi to measure employee performance, and ensure accountability by learning how to measure compliance kpi.
Ideal for guiding data-driven decisions, improving team alignment, and refining brand and marketing strategies.
How to use this KPI report template:
This table is easy to use and customize. Just follow these steps:
- Install and activate Ninja Tables on your WordPress dashboard.
- Go to Ninja Tables → Tables → Import Table.
- Select the JSON file, and in the import format section, choose: JSON- Exported From Ninja Tables.
- Click on the Import button and wait for the confirmation message.
After the import is successful, you can add custom filters, customize the conditional formatting value, update the key metrics and name, and populate the table with your entries. You can also add new columns, control responsive breakpoints, change the colors, and styles. Edit your table as needed to match your brand’s aesthetic or purpose.
Once you are done, copy the shortcode to your clipboard. You can paste it on any page or post where you want to display the table. Enjoy!
***This table may include some Pro features. Get Ninja Tables Pro for all-access fun!
You May Also Like
-
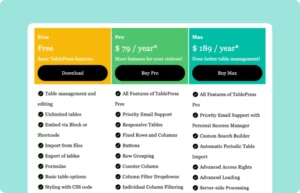
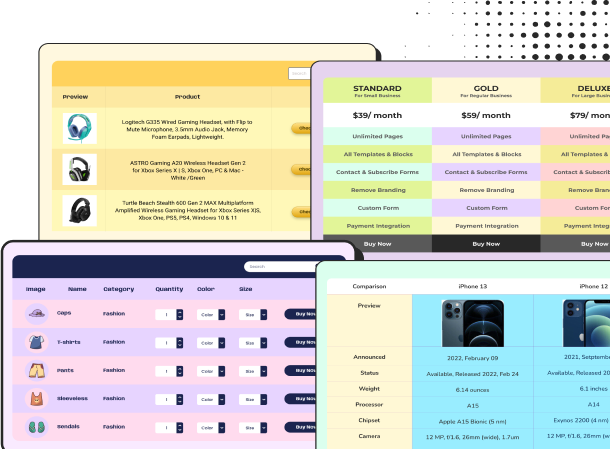
TablePress Pricing Table
Customize this table to create a pricing table like TablePress.
-
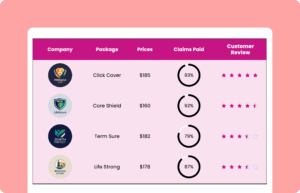
Insurance Policy Review
Help customers find the best insurance plan with comparisons and reviews.
-
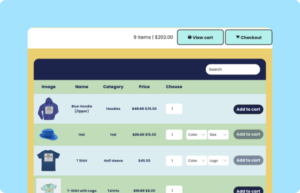
WooCommerce Product Table
Show WooCommerce products in tables anywhere on your site.
Craft Responsive Data Tables Fast!
Ninja Tables is the best table plugin to show data in an organized table format.