
Ratings and Reviews in Data Tables

Do you know the real power behind Netflix’s ‘Top 10’ or Billboard Chart’s ‘Billboard Hot 100’? It’s not just clever marketing– it’s the undeniable pull of collective reviews of viewers. When millions of people point to something and say “This is worth your time,” we listen. And the numbers back this up: 75.5% of us trust online reviews as much as personal recommendations.
But here’s the twist: while ratings and reviews have transformed our digital lives, most data tables remain frozen– static grids of numbers missing the human story behind them. What if your tables could do more than just display data? Imagine them showcasing real user experiences, highlighting what people trust, and guiding decisions through authentic feedback.
With a table builder plugin like Ninja Tables, we’re bridging the gap between raw data and human experience. Think of it as giving your tables a voice—one that speaks through star ratings, user feedback, and authentic use values.
Why Include Ratings and Reviews in Data Tables?
Integrating ratings and reviews into data tables adds depth and makes decision-making more intuitive and informed.
Ratings offer a quick visual summary of user experience and overall product performance, while reviews provide qualitative insights into strengths, weaknesses, limitations, and real use cases.
Think of it as a SWOT analysis brought to life, helping users better understand technical jibber jabber and the product’s real value.
From a technical standpoint, including ratings and reviews in your data tables transforms them into interactive tools. For instance, using sortable columns for ratings allows users to rank items based on popularity or performance. Filters based on star ratings or keyword searches in reviews further personalize the browsing experience, empowering users to find exactly what they need faster.
Here’s why ratings and reviews are game-changers for data tables:
- Improve User Trust: Ratings provide instant credibility signals, helping users quickly identify trusted products, services, or content.
- Meaningful Context: Raw numbers tell what happened, but ratings reveal why it matters, and how it can be useful in decision-making.
- Intuitive design: Users can quickly filter and sort based on ratings, cutting through information overload to find the best options. This reduces decision fatigue and speeds up the selection process.
- Engagement: Tables with integrated ratings typically see higher engagement rates than standard data tables.
- Social Proof: As your data grows, ratings provide consistent quality indicators that help maintain user trust and guide decisions, even with large datasets.
- Improved visibility: Including ratings and reviews in tables enhances relevance for local keyword searches, reduces bounce rates, and boosts visibility in location-specific search results.
- Effective comparison: These features also help you to create product comparison tables, allowing users to easily compare multiple products based on real user feedback and ratings.
Designing Effective Rating and Review Tables
Designing effective rating and review tables isn’t just about tossing in some stars, and texts here and there, it’s about creating a smooth, user-friendly way to show valuable insights. The goal is to make it easy for people to understand both the numbers and the stories behind them.
A well-designed table does this by combining clear visuals, like star ratings, with interactive features like filters and sorting options. When done right, these tables don’t just look good—they help users make confident, informed decisions effortlessly. It’s all about blending usability with authenticity to create a seamless user experience.
Key Components of Ratings and Reviews in Tables
To incorporate ratings and reviews into your data tables, start by gathering and organizing customer feedback. Analyze their insights to identify common themes—highlighting the features they appreciate most and also working on areas they need improvement on. Their POV is the main concern here, bring them upfront for clarity and accountability.
- Star Ratings:
The universal way to show ratings visually through stars is intuitive and instantly recognizable. Use consistent symbols and consider half-stars for precision. - Review Summaries:
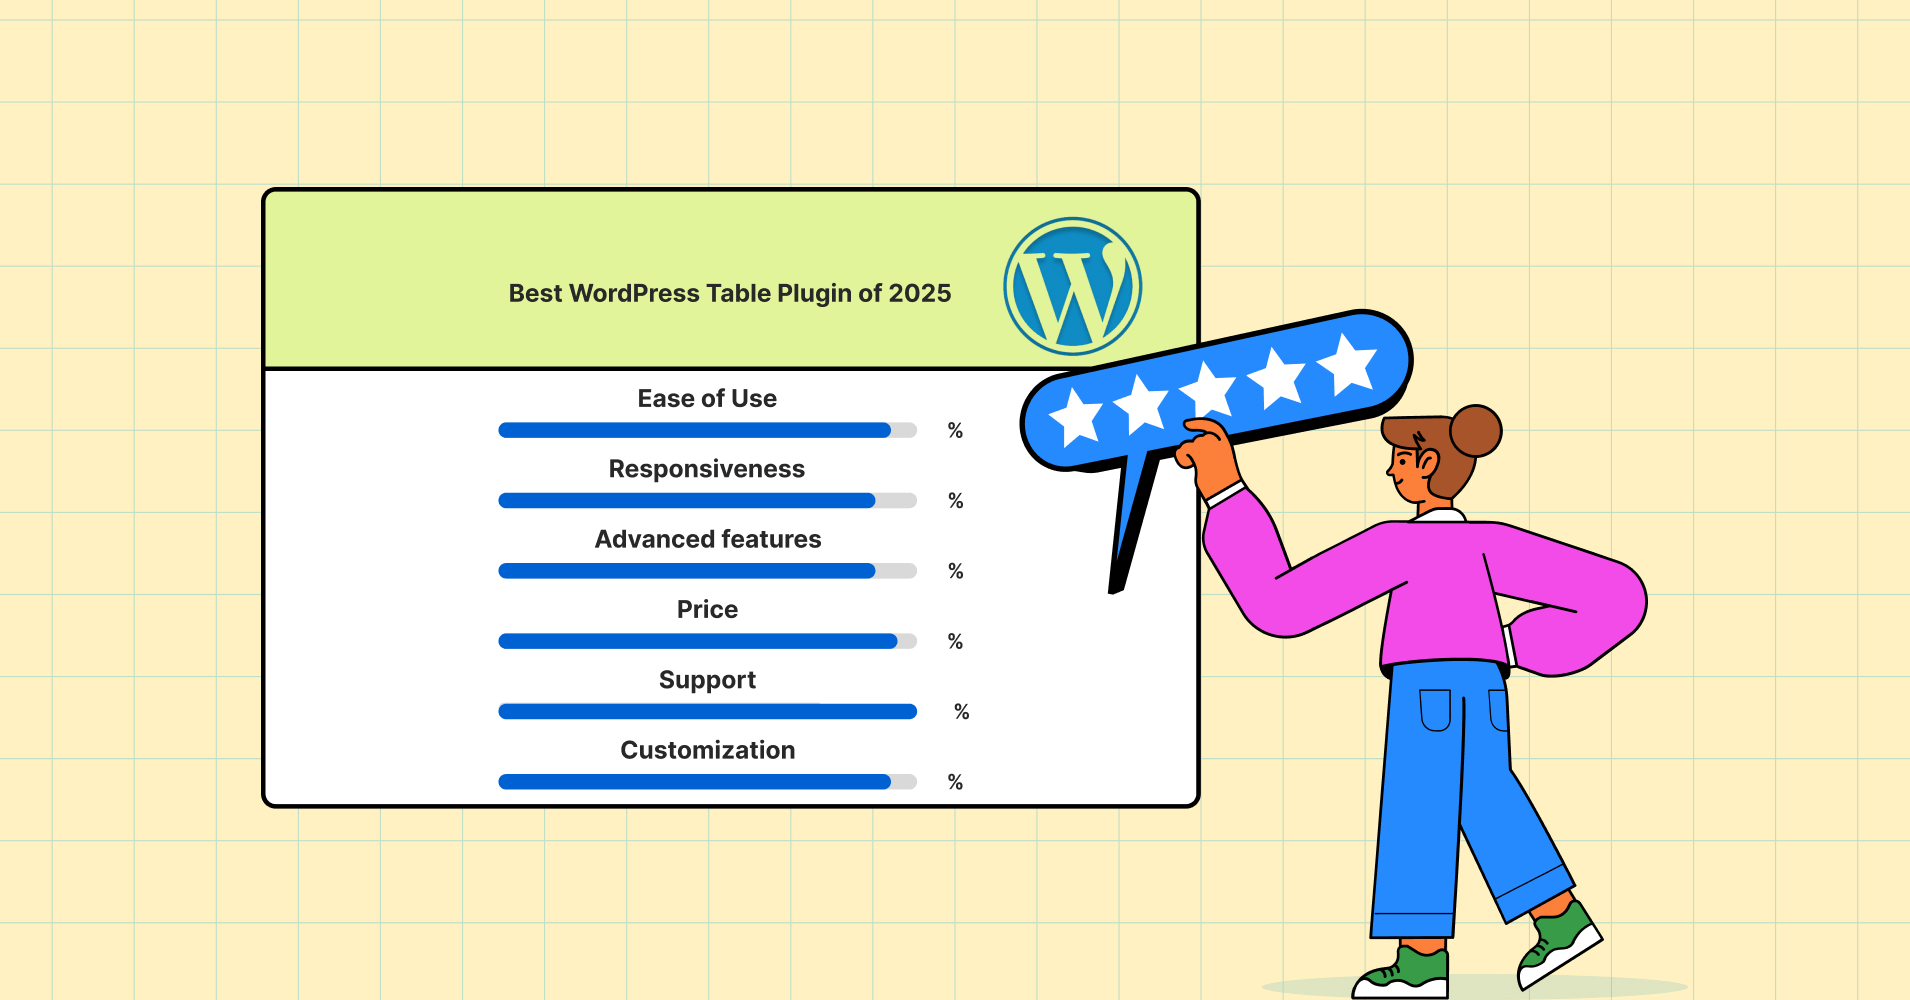
Summaries like “100 reviews” provide context for the ratings. Include both the average rating and the total number of reviews for better transparency. - Visual Indicators:
Explain raw numbers better you can opt for progress bars to show the data %. - Sort and Filter Options:
Allow users to sort by highest rating, most reviews, or even filter by specific thresholds in tabular format. Like -Show only items rated “4 and above.” - Distinguishing colors:
Use colors to make the data more actionable. For example, use conditional formatting to highlight specific no columns/rows based on ratings in different colors.
All these advanced features come together as a complete package. While you might search for table builder plugins that offer everything, only a few come close—until now. Ninja Tables brings advanced dynamic features that let you design your tables to your exact needs. It’s programmed to handle the heavy lifting, so you can focus on creating the perfect table effortlessly. Let’s see how it can streamline your tasks!
Create a Review Table Using Ninja Tables
For WordPress users seeking a practical way to showcase ratings and reviews, Ninja Tables offers a structured and user-focused solution. Follow these steps to build your custom review table effortlessly with this WordPress table builder plugin.
- Install Ninja Tables in your dashboard.
- Select drag and drop table mode, and select your column and row numbers.
- Add all the necessary details, such as customer reviews and quotes about the specific products, and create a section that is more highlighted to show what the product/service is all about.
- You can add a pros and cons section with the classifications.
- Don’t shy away from using split/merge cells when necessary.
- Use the advanced mode item ‘Progress’ from the drag-and-drop side menu to show any quantitative percentage of overall reviews or performance marks.
- Add ratings from the left sidebar, simply drag and drop the element in the cell you want it to place.
- You can easily customize color, the maximum limit for stars, size, alignment, show rating value, etc from the bar.
- Here’s a detailed guide on how to create a product review table in Ninja Tables.
WP Ratings 4.6 out of 5 Stars | 94% | ||
Ease Of Use 95% Design 90% Settings 90% Price 95% Support 100% Overall Quality 94% | Pros
Cons
Pricing per year
| ||
You can easily create review tables using Ninja Tables’ free templates. Just head over to the templates page and choose the “Review Table” category.
Pick a design you like, download the JSON file, and import it into the “Add Table” section in Ninja Tables. From there, you can edit, customize, and tweak it to perfectly match your brand’s personality. It’s that simple to build tables that are both functional and uniquely yours!
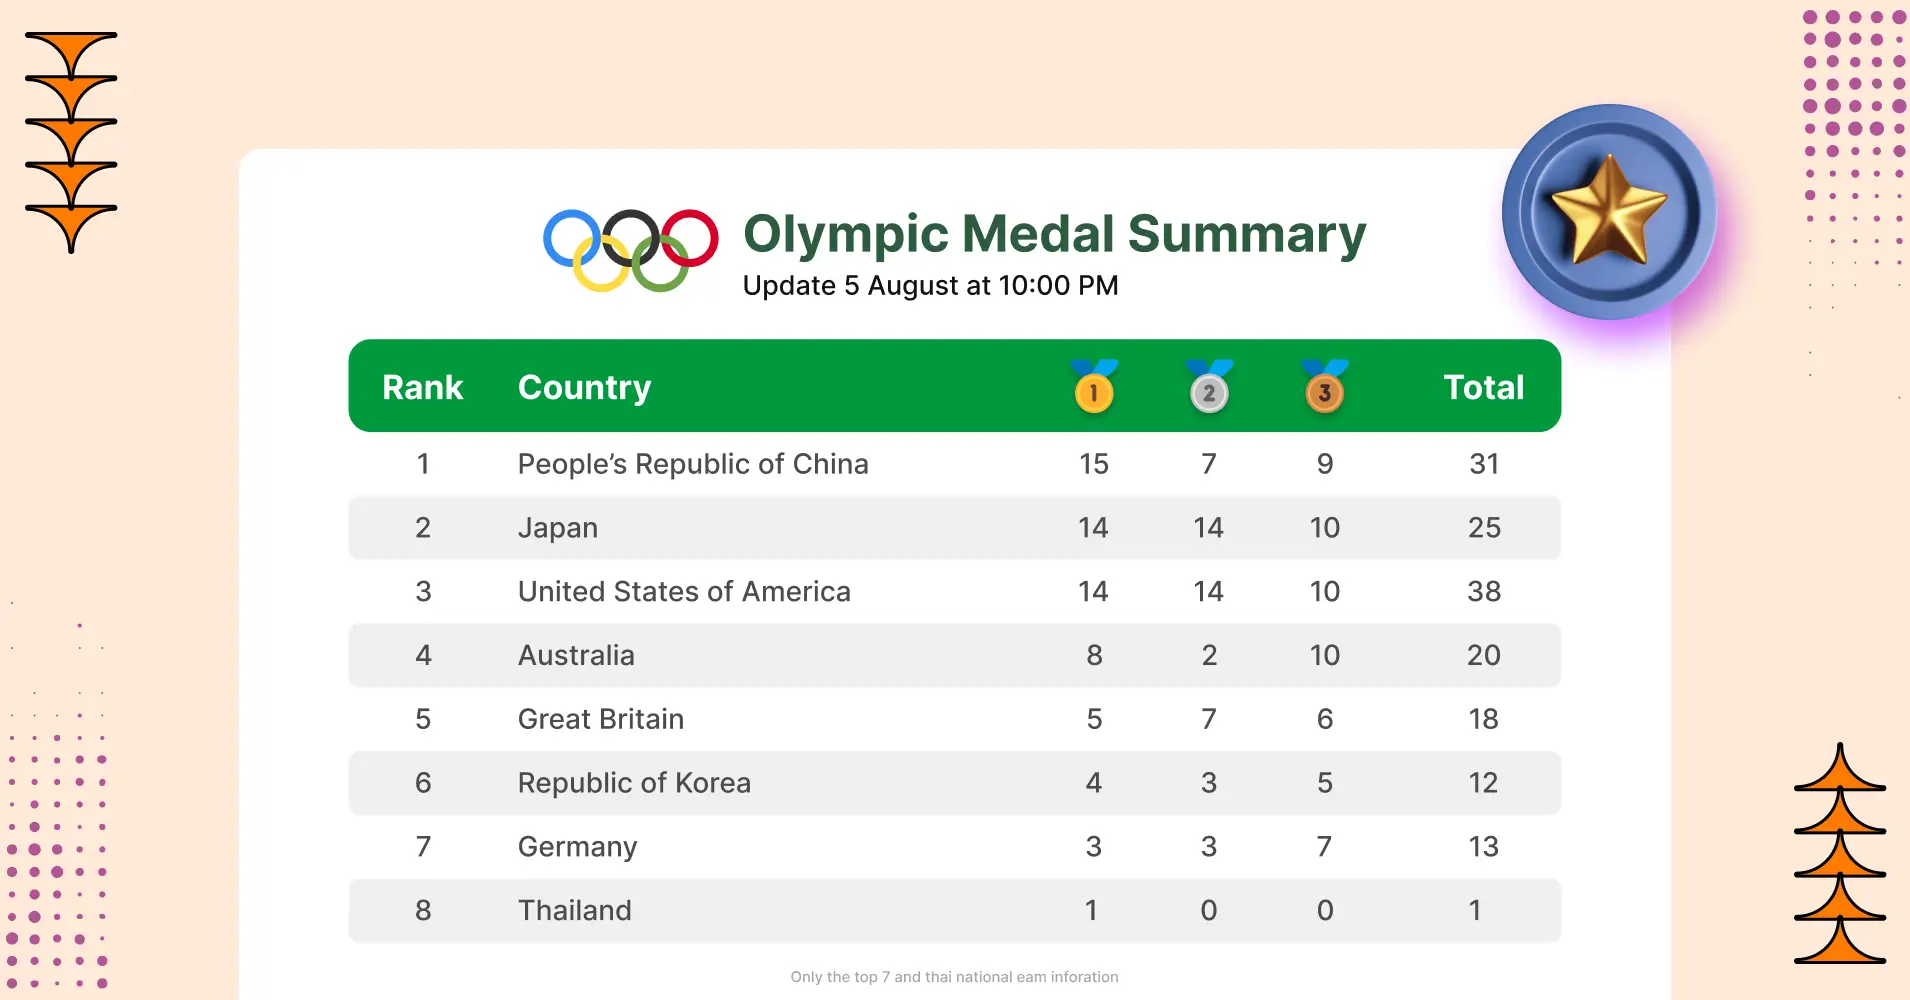
Here are a few more demos of how your review tables will look like using Ninja Tables.
GSMArena | Product Review I phone 15  The iPhone 15 boasts a Super Retina XDR display, an A16 Bionic chip for powerful performance, and an advanced dual-camera system with a 48MP main sensor for super-high-resolution photos | Jane  Very smooth and fast performance,super camera, but heating | John  Heating issue while charging. It heats up like anything, it will |
AT & T | |||
Trustpilot | Juan  Awesome phone with awesome features. Specifically in love with | Pablo  Overall very good product, specially long lasting battery, | |
Techradar | |||
Pros
| Cons
| ||
Product review table created with Ninja Tables
| ISBN | COVER | TITLE | AUTHOR | GENRE | RATING | BUY |
|---|---|---|---|---|---|---|
| 0-31-97-0 |  | The Haunting | Q. Stone | Horror/Mystery | Grab | |
| 0-65-28-7 |  | Hill House | G. R. Tom | Mystery | Grab | |
| 0-83-08-8 |  | Lake Side | Allan P. | Horror/Mystery | Grab | |
| 0-31-80-5 |  | Alone | L. Greer | Horror/Mystery | Grab | |
| 0-31-20-3 |  | Midnight Rain | Jane Dutch | Mystery | Grab | |
| 0-48-76-8 | | Mu-seoun | Yong-su Rick | Horror | Grab | |
| 0-71-54-3 |  | Night Coach | Jenny Halpert | Horror/Mystery | Grab |
Book review table made by Ninja Tables
| Poster | Movie Title | Rating | Trailer | IMDB Link |
|---|---|---|---|---|
 | Minions: The Rise of Gru | 6.6 |  | Learn more |
 | 12 Angry Men | 8.9 |  | Learn more |
 | Pulp Fiction | 8.9 |  | Learn more |
 | The Dark Knight | 9.3 |  | Learn more |
‘Movie review table’ courtesy of Ninja Tables
How Ratings and Reviews Impact Customers’ Purchase Decisions
Remember when our parents used to ask, “If your friends jump off a cliff, will you?” The idea was to teach us not to follow blindly, but let’s be honest—social proof heavily influences our shopping choices, even today.
Ratings and reviews are a form of collective wisdom. They allow customers to make informed decisions based on the experiences of others. Unlike flashy ads or well-crafted marketing gimmicks, reviews create authenticity. They act as personal testimonies, often speaking directly to potential buyers in a relatable and trustworthy tone.
Including ‘what others think of the products’ in a clear, organized table format helps customers save time. Instead of scouring blogs, review sections, or social media for insights, everything they need is presented at a glance. This approach not only streamlines decision-making but also reduces return rates. Also, people want to authenticate before spending their money on something. Seeing what others got, and how it worked for them, helps them decide on their choices.
Conclusion
Social proof taps into our instinct to trust relatable experiences. After all, who’s more reliable for honest feedback than real customers? This authenticity stands out as the ultimate tool in a world saturated with marketing noise.
Similarly, integrating ratings and reviews into your data tables is more than just a design choice—it’s a practical step toward enhancing usability and decision-making. By combining numerical precision with qualitative insights, these tables bridge the gap between information and trust. Effective design goes beyond aesthetics, such as technical elements like sortable columns, filterable ratings, and visual cues to deliver a seamless and intuitive experience.
The key lies in thoughtful design—balancing usability with authenticity while leveraging tools like Ninja Tables to streamline the process. Whether you’re showcasing product reviews, customer feedback, or performance metrics, the right table design makes it effortless for users to explore, compare, and decide.
Ninja Tables– Easiest Table Plugin in WordPress


Add your first comment to this post