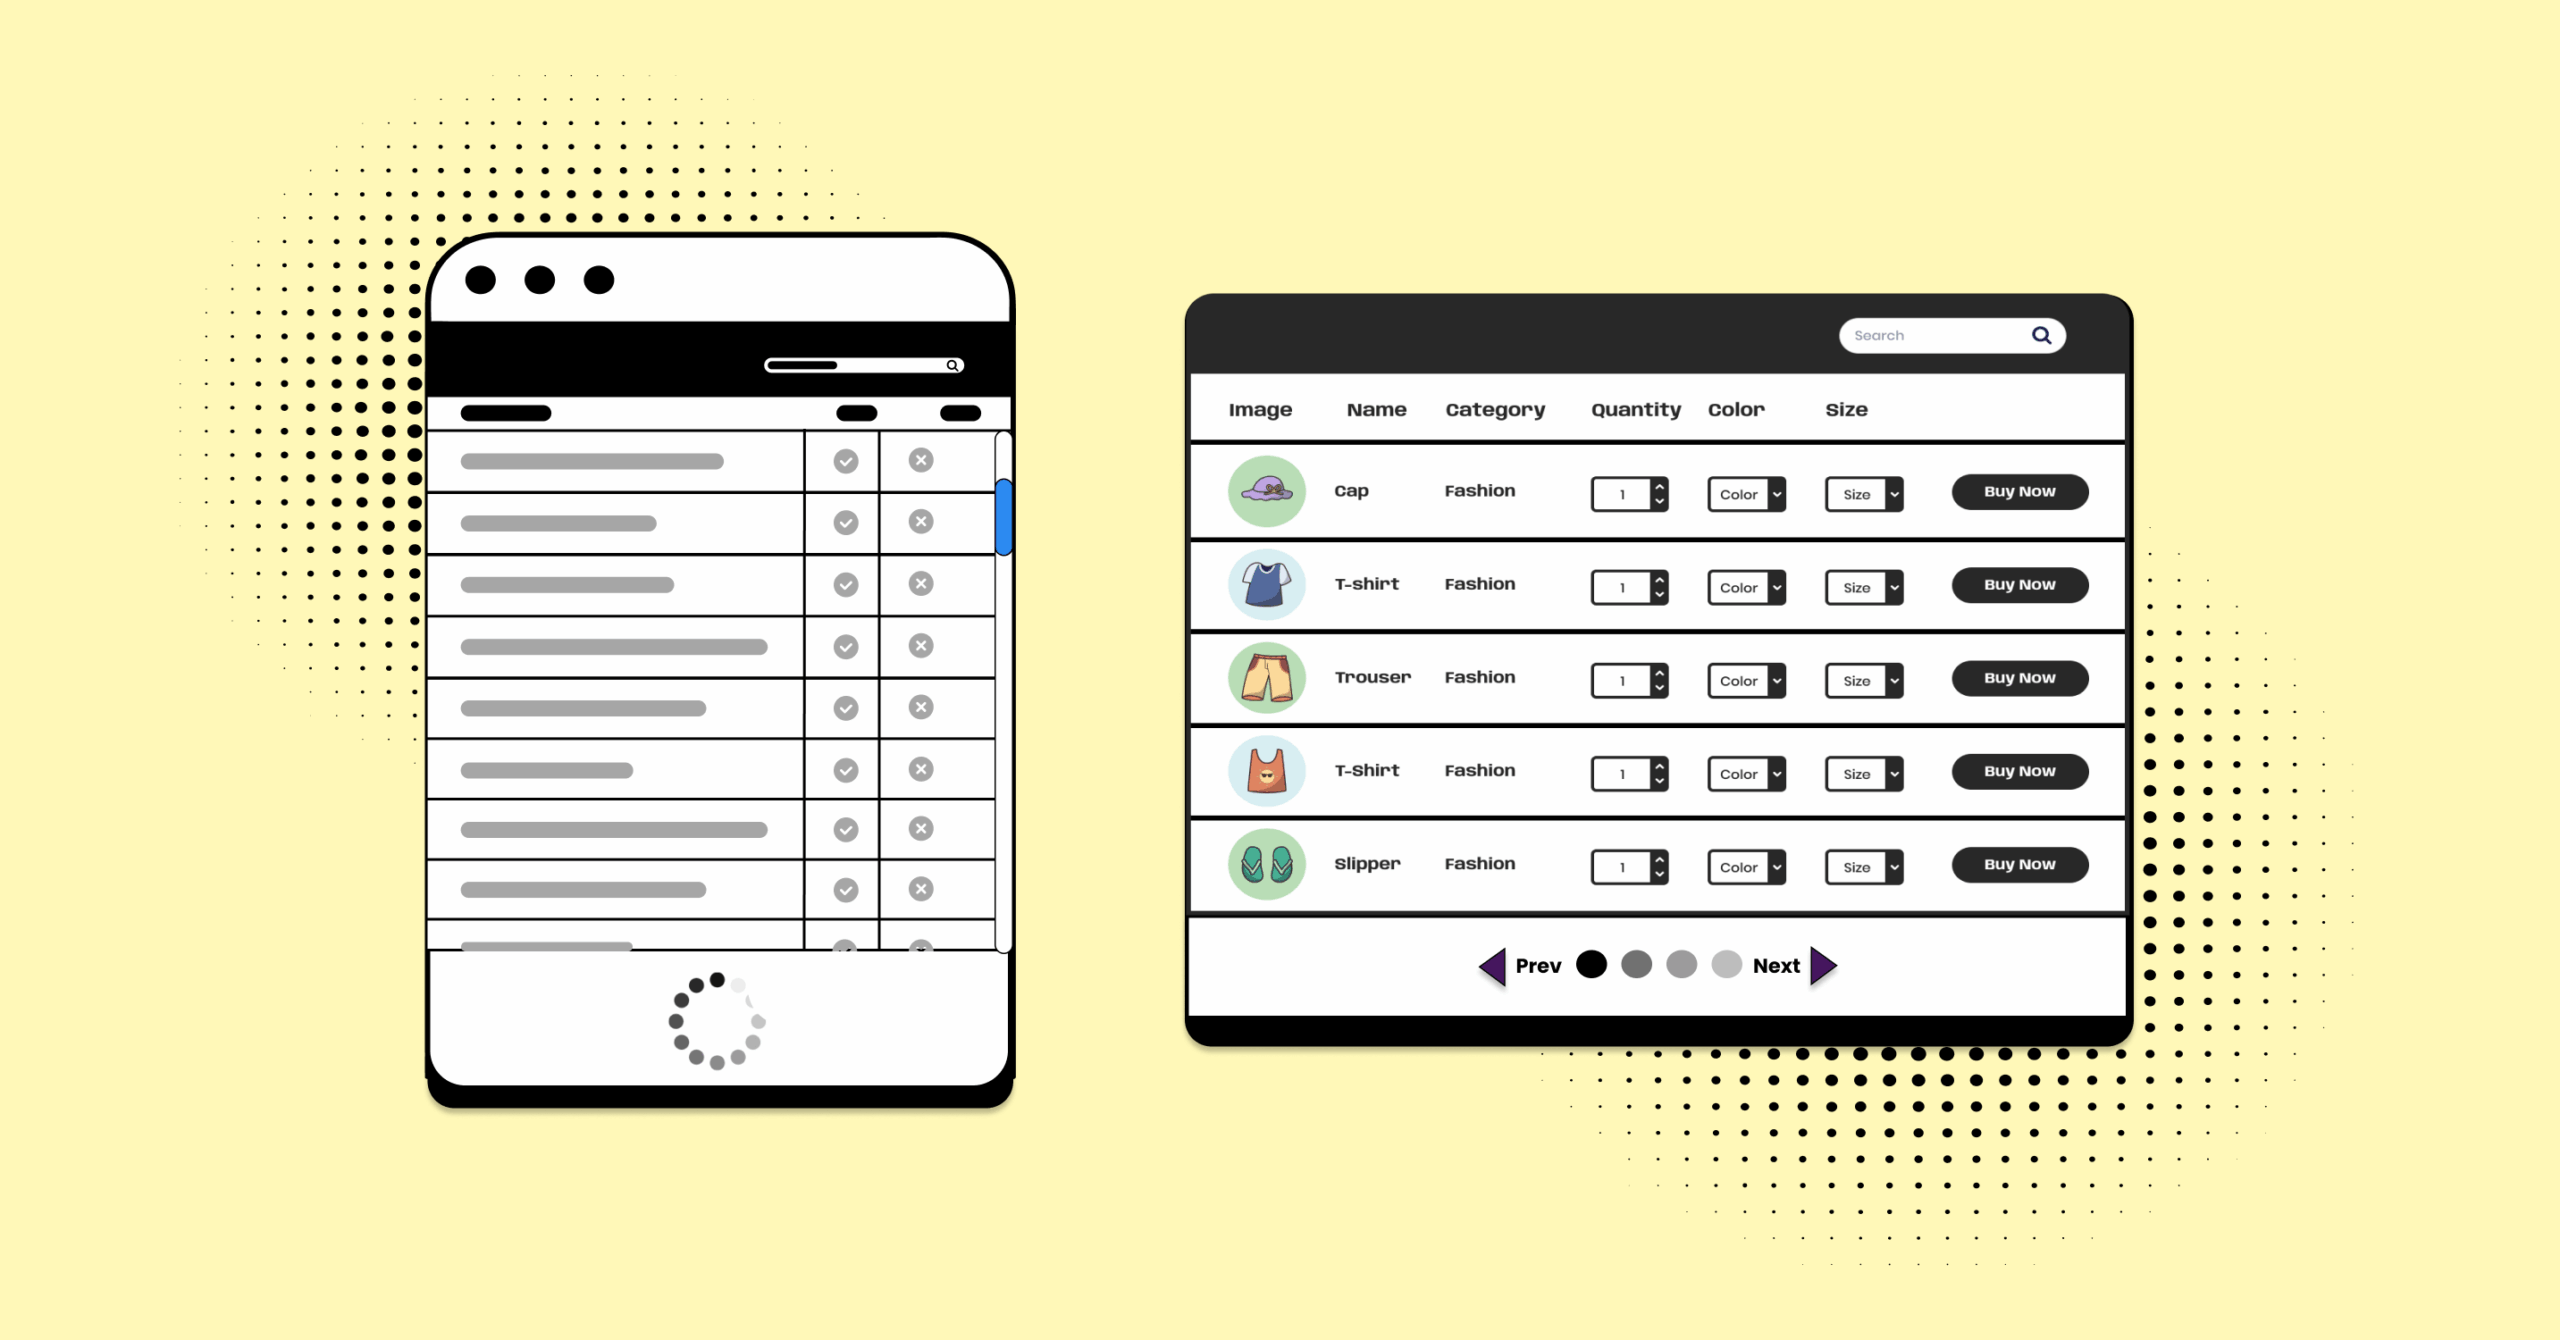
Sticky Headers vs Fixed Columns in Product Table: What’s Better on Mobile?
You’re comparing five different food processors on your phone during your commute in the BFCM sale rush. The table loads,…
Get This Special Discount!
Explore expert tips in our category for actionable insights. Elevate your skills and stay ahead with practical advice. Your guide to success! #TipsPost

You’re comparing five different food processors on your phone during your commute in the BFCM sale rush. The table loads,…

You know that feeling when you land on a pricing page and… nothing makes sense? Three, five, seven plans- features…

Purchasing online is convenient for everyone since we all have a phone on our hands. And with our attention span…

Every lazy scroll, clicks, or swipe from your customer has a story and intent. Their interaction tells you what’s working…
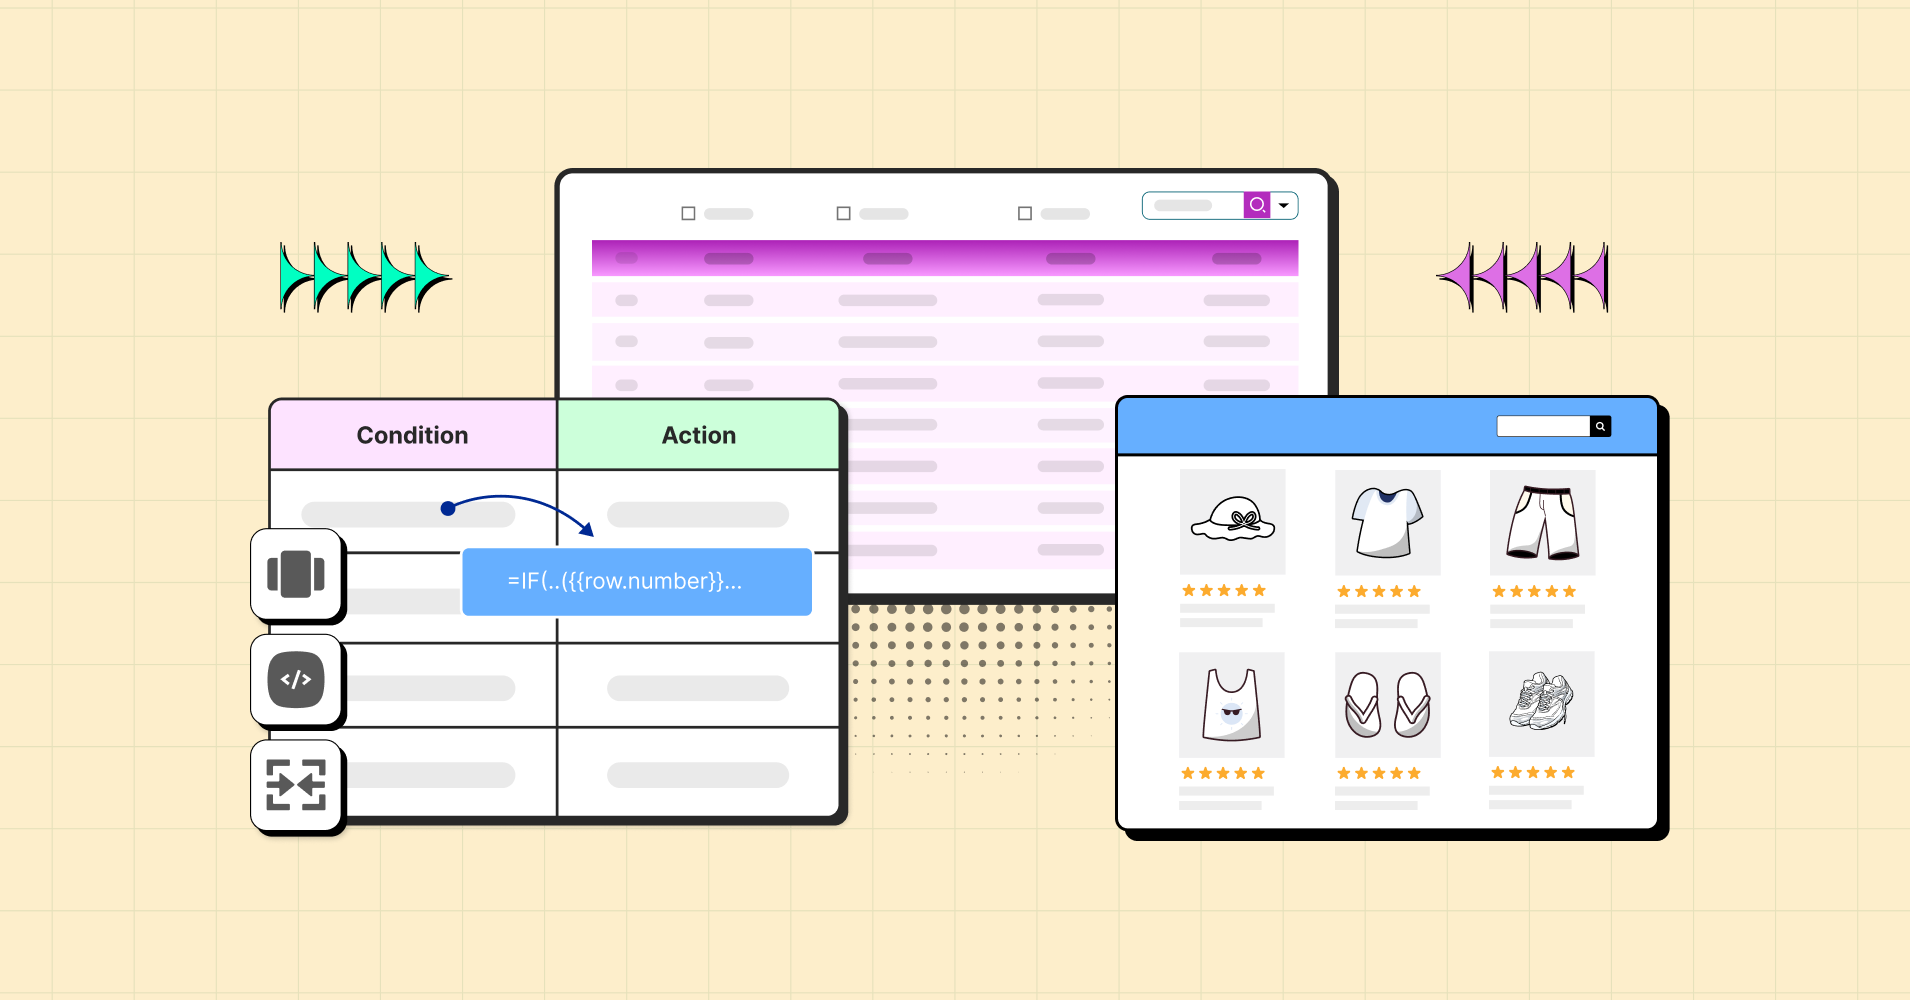
Not all tables are created equal. Sure, they all have that familiar structure, but their purposes couldn’t be more different….

TL;DR: Holiday sales are a battlefield of choices. Discounts, bundles, and endless “best deal” claims bombard shoppers. Limited-time offers, short…

Most website visitors leave if they can’t get quick answers to simple questions like “How much will this cost?” or…

Key takeaways: To increase holiday sales and conversion, prepare early by following this list: Blink and it’s the sales season!…
Takeaways:Infinite scroll and pagination directly influence how users browse, how search engines see your site, and how easily shoppers make…

Takeaways:Focus on the data points and information that actually influence buying decisions. Show detailed property listings in different data tables,…