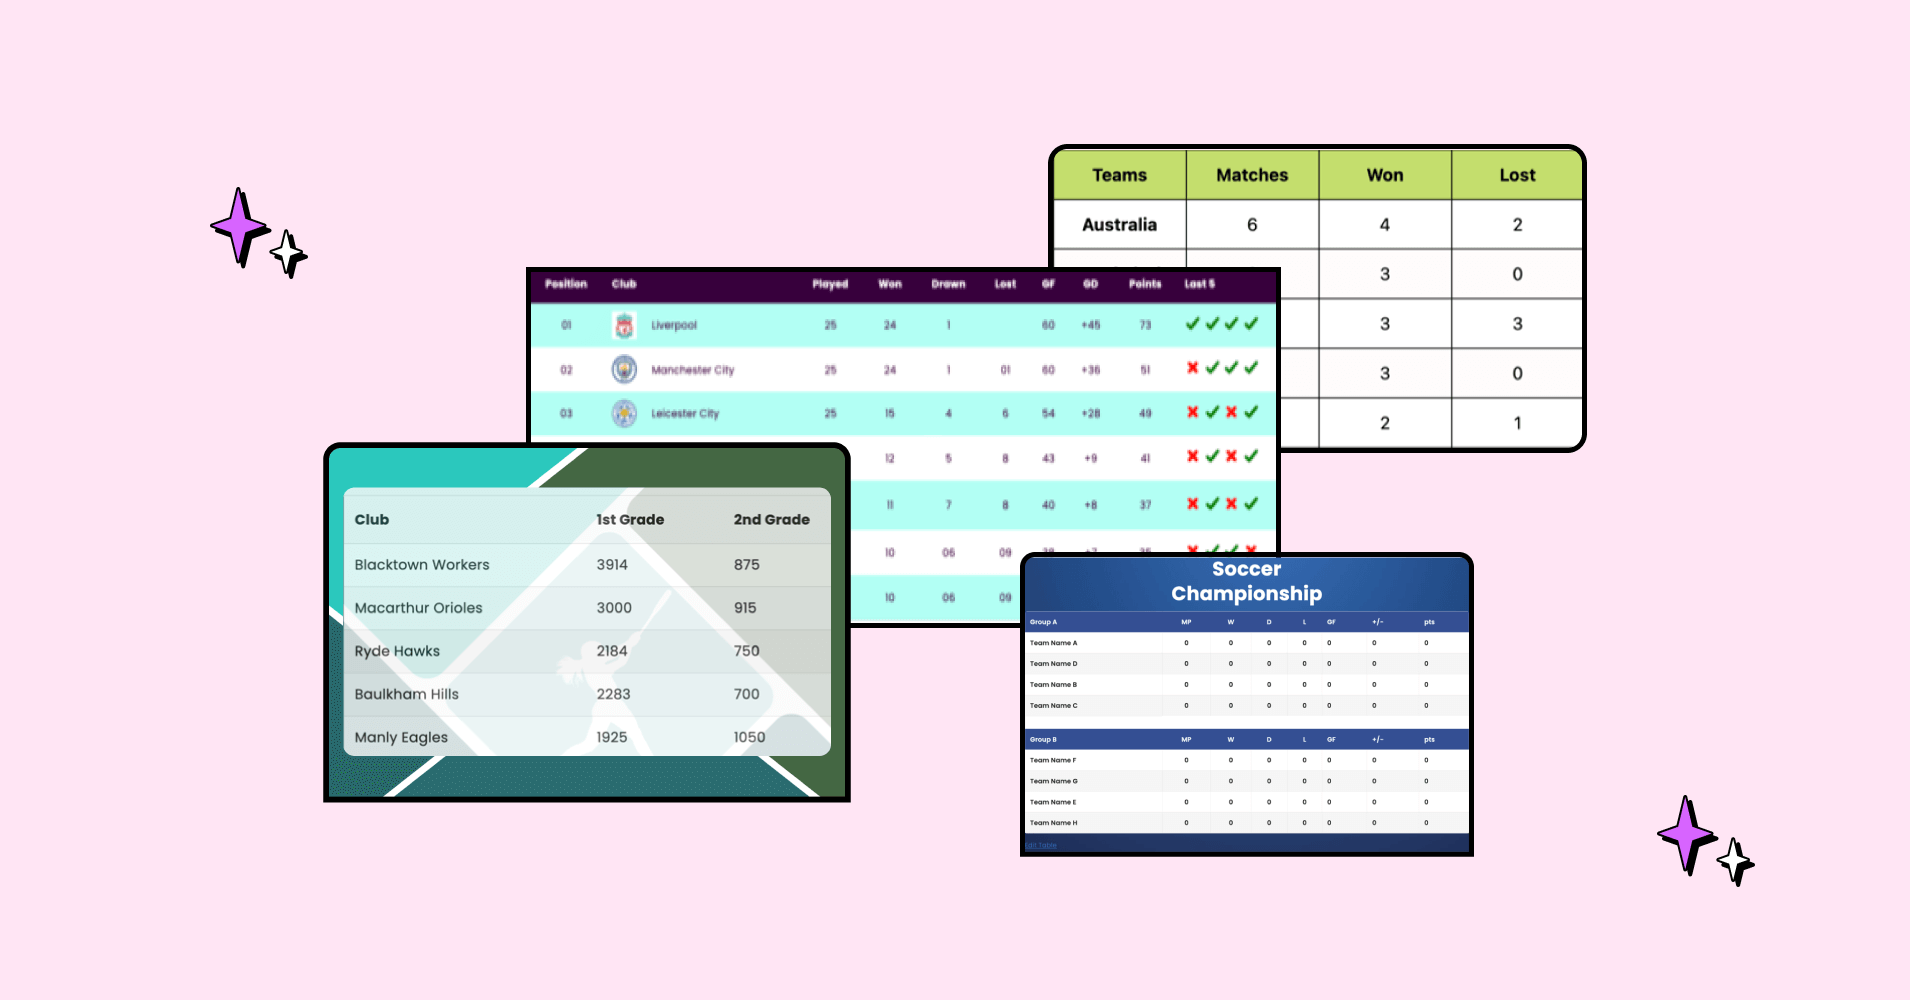
Upgrade Your Sports Website: Add Live Score & Points Table
Let’s say you’re planning to run a sports website with real-time scores, engaging display, and clean information for your sports-geek…
Get This Special Discount!
Explore expert tips in our category for actionable insights. Elevate your skills and stay ahead with practical advice. Your guide to success! #TipsPost
Let’s say you’re planning to run a sports website with real-time scores, engaging display, and clean information for your sports-geek…

It feels like we blinked, and 2024 is already in the rearview mirror—and 2025 came through! Time flies when you’re…
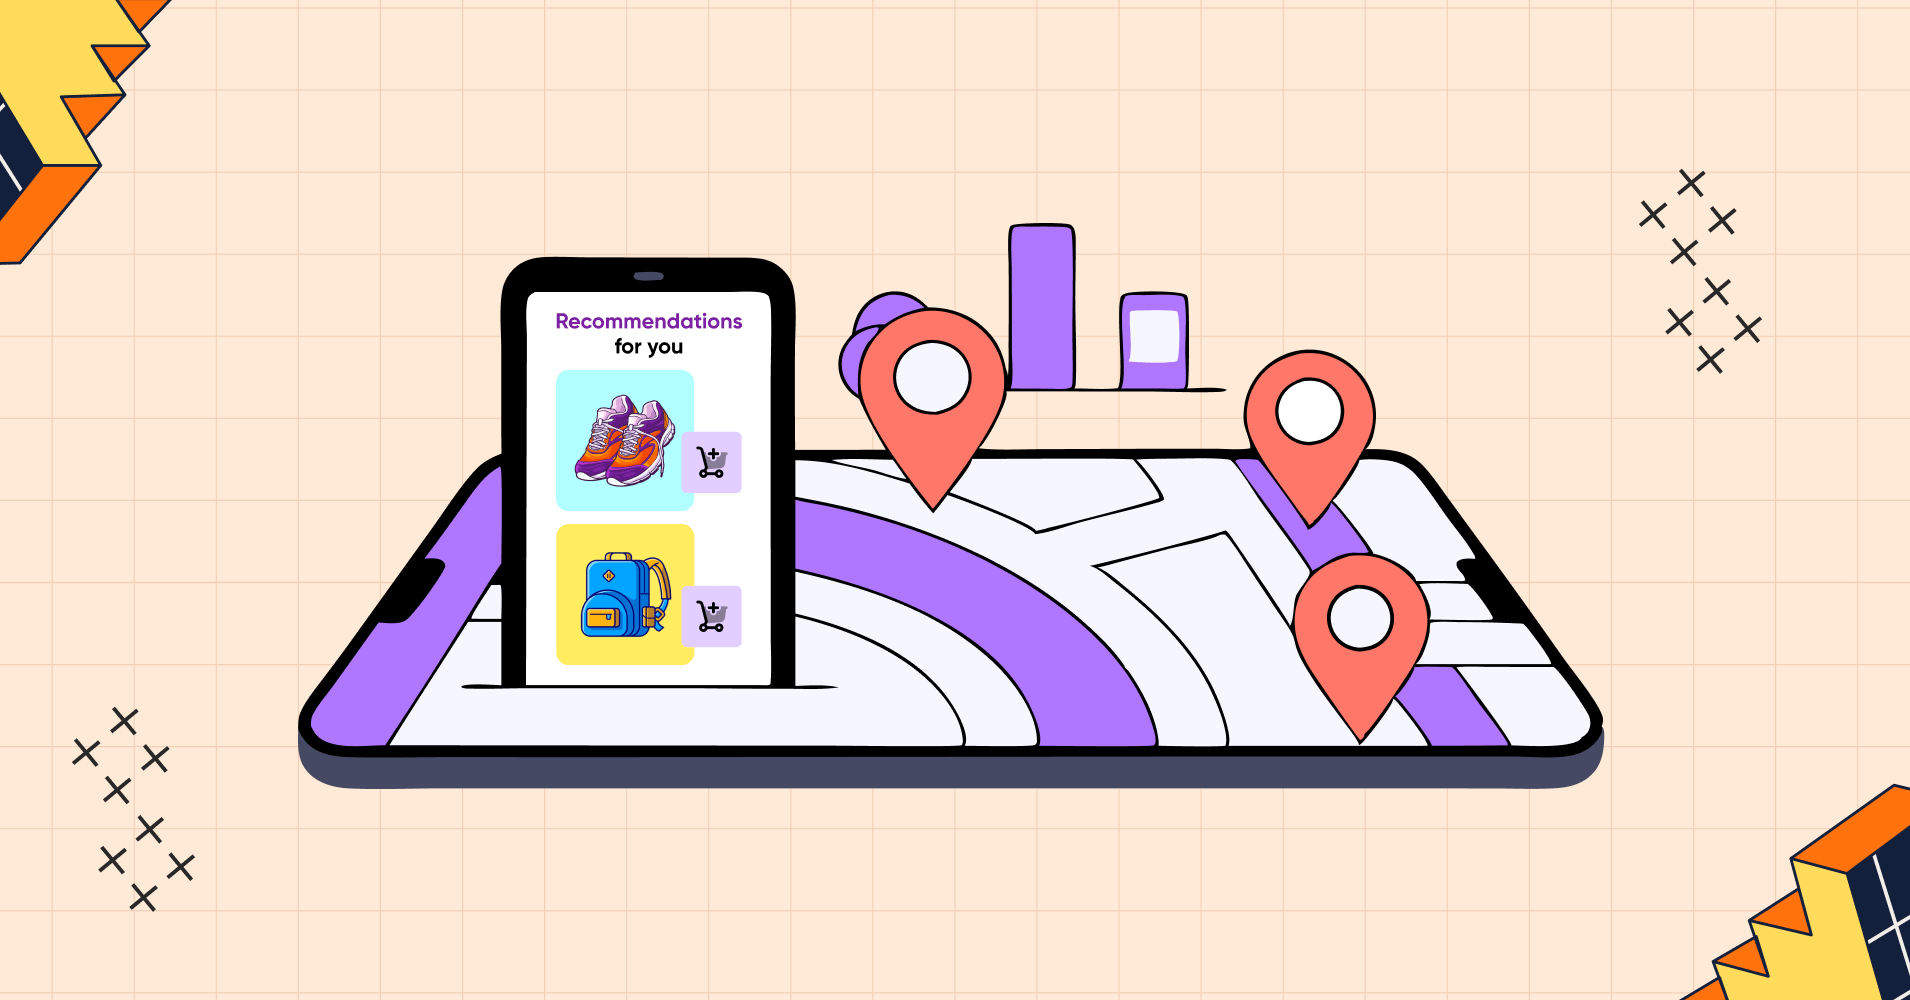
People want to feel special when they shop online as if their purchase was designed specifically for them. Personalization is…

Love, Actually- came out over 20 years ago, yet somehow, every Valentine’s Day still feels incomplete without watching it. And…

Ever feel like your digital ads are just… missing the mark? You’re not alone. A friend recently asked me: “We’re spending money on…

So you’re hunting for the perfect gadget your dad or tech-loving friend has been hinting at for months. You want…
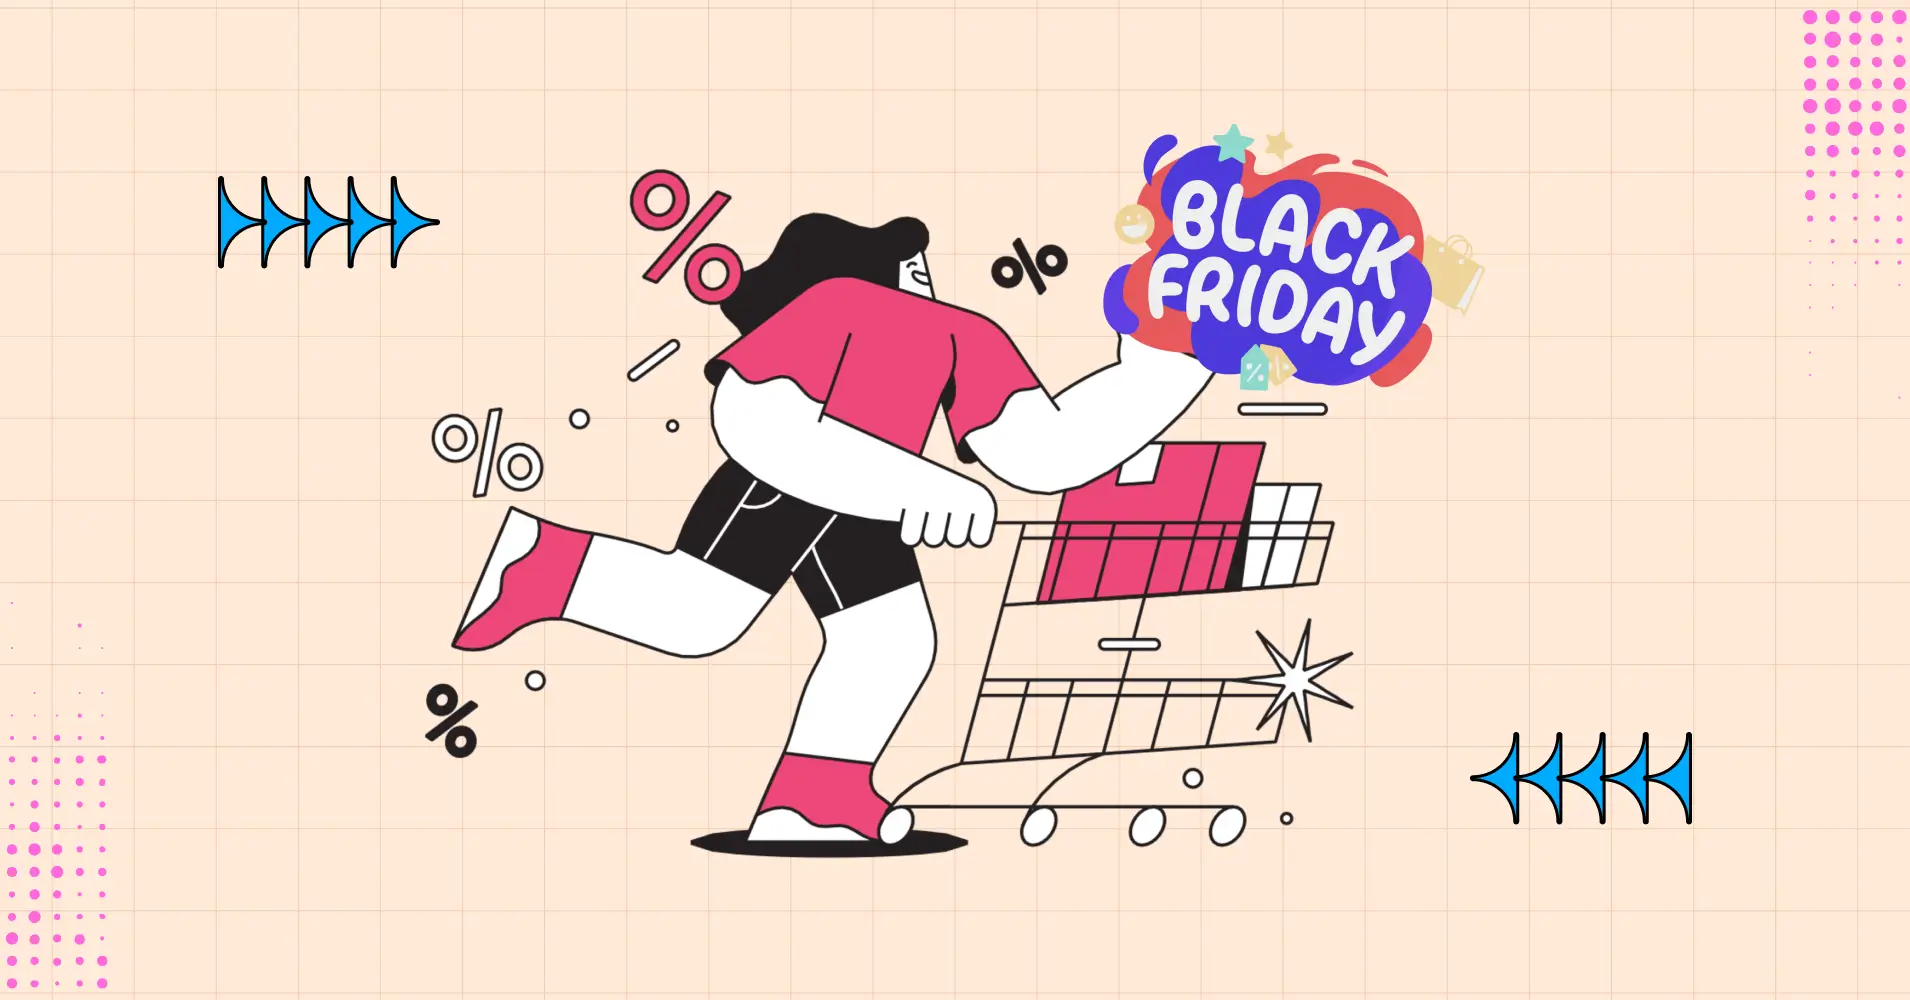
Black Friday is now more than just another shopping event; it’s a yearly tradition that drives shoppers into a frenzy,…

Takeaways:Fall shoppers are ready for cozy homes, festive deals, and quick decisions. To meet them there- ‘High-fun, Low-Effort’ celebrations are…
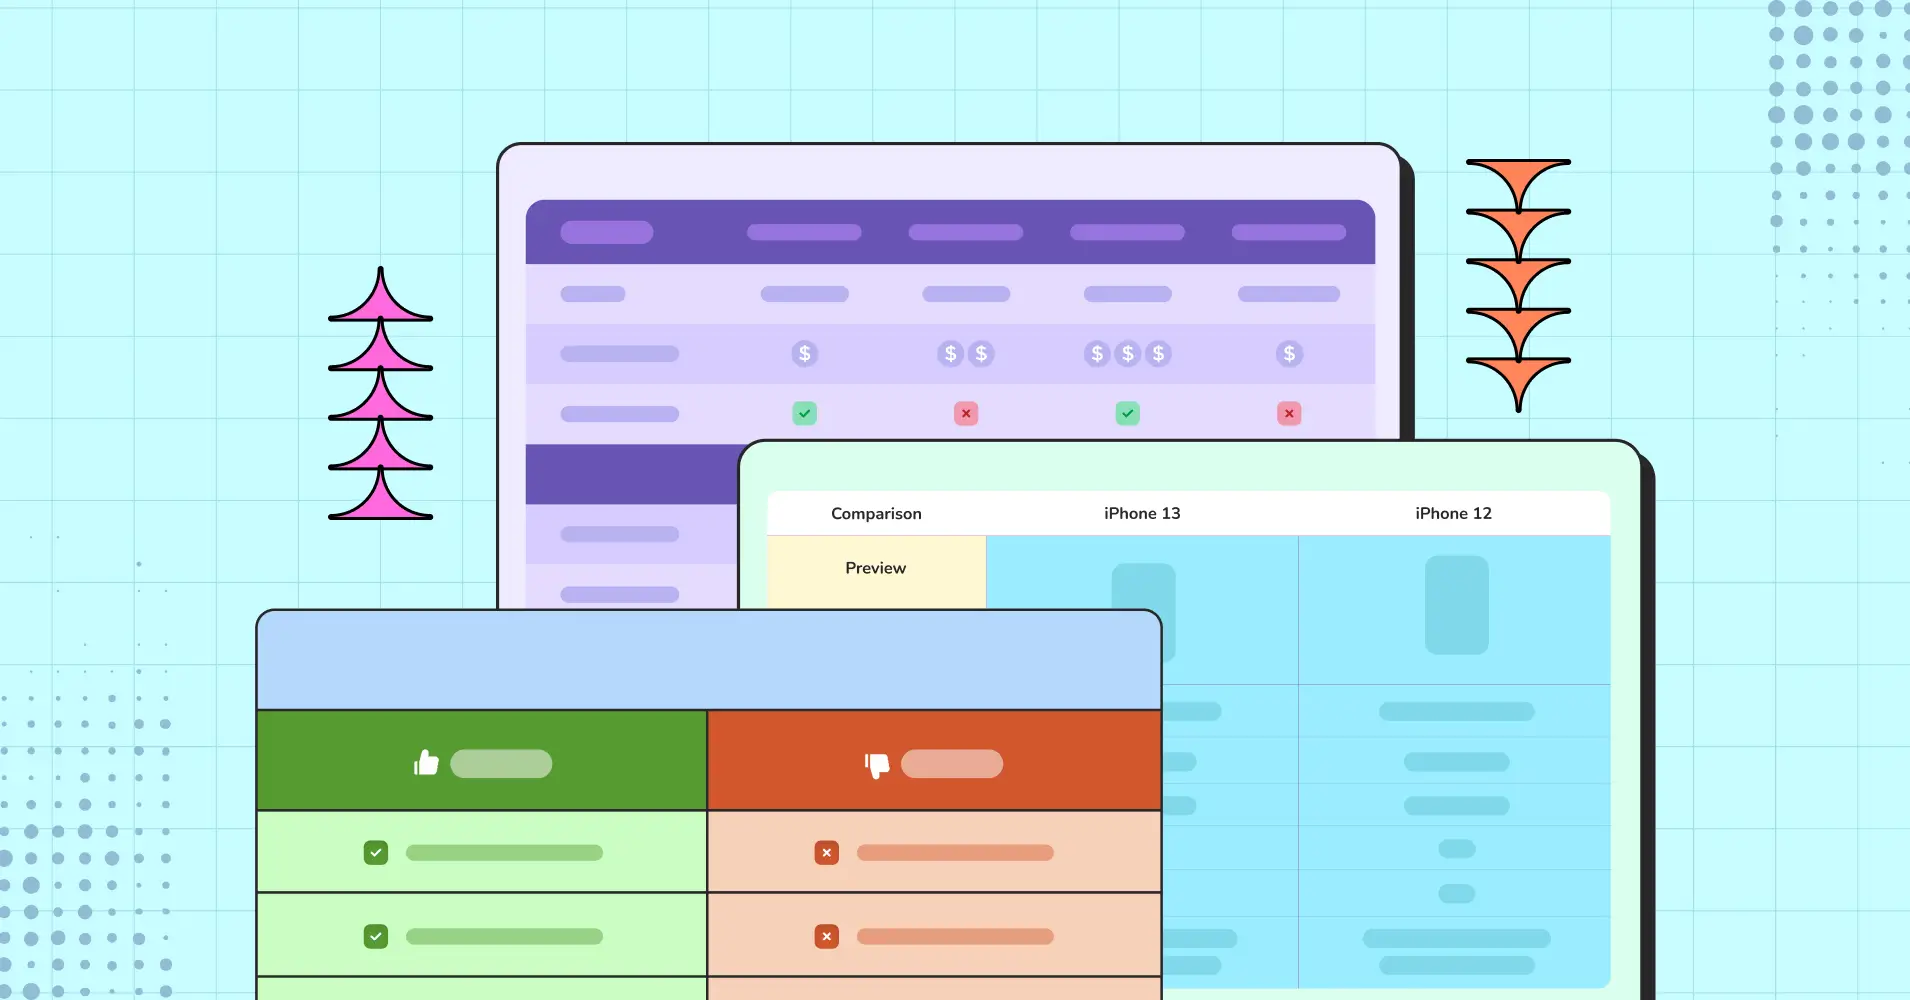
A feature comparison table is like speed dating— quick, efficient, and no small talk required! Instead of swiping left on…
Ever feel overwhelmed by too many choices? Stuck in an endless scroll-hole trying to decide between products, services, or even…