Interactive Data Visualization in WordPress: Tables and Charts
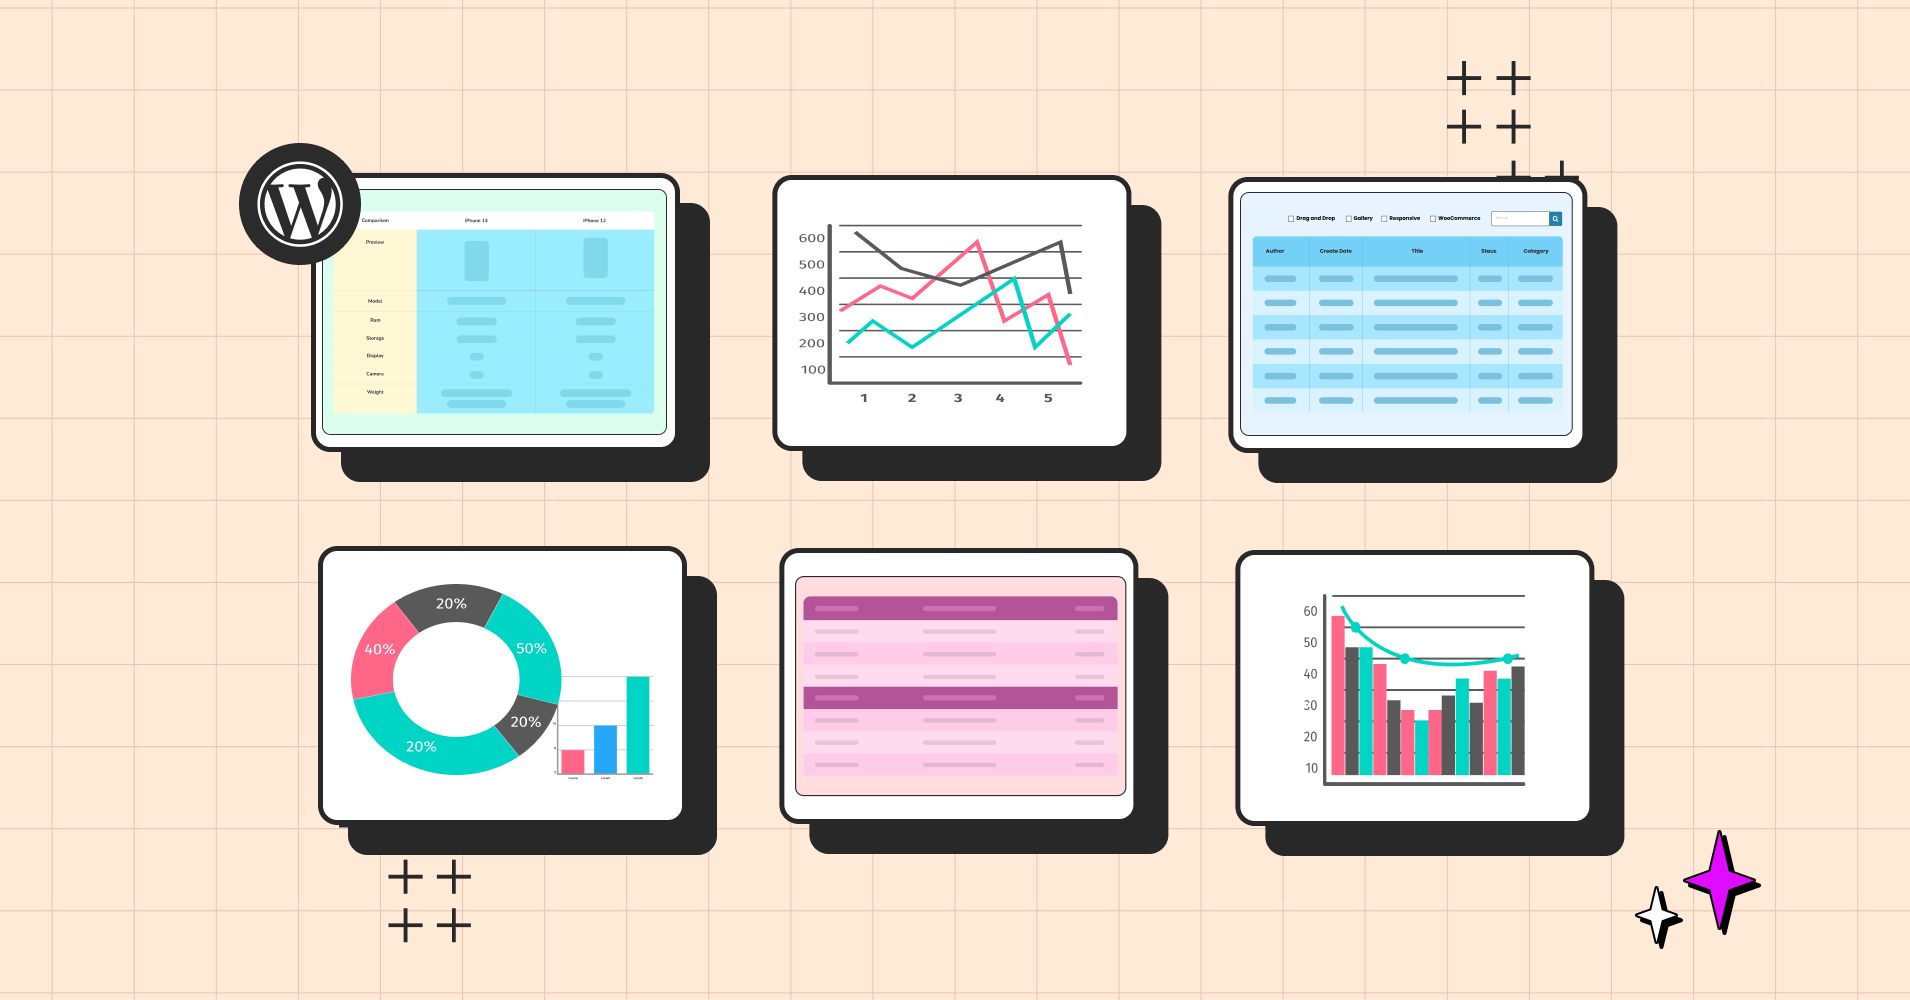
Ever stared at a static spreadsheet and wished it could tell a better story? Enter interactive data visualization- your knight in shining armor (Quite literally!)
Data visualization in WordPress isn’t just about making numbers look pretty—it’s about sparking those “aha!” moments when complex information suddenly clicks. While most websites settle for basic charts and static tables, today’s WordPress ecosystem offers sophisticated tools that transform raw data into compelling, interactive experiences without crossing into gimmickry.
With Ninja Tables, your data becomes a playground of possibilities. Users can sort, filter, and search through information effortlessly, uncovering insights that matter to them. No more endless scrolling or squinting at tiny cells – just smooth, intuitive exploration that puts your audience in control.
What Is Interactive Data Visualization
‘Visual Information Seeking Mantra’: Overview first, Zoom and filter, then more details on demand- Ben Schneiderman.
Interactive data visualization revolutionizes how we understand complex information. Imagine the leap from a printed map to Google Maps – this same transformation applies to all forms of data presentation. The difference between a printed map and Google Maps is that one is fixed, while the other lets you zoom, pan, and explore at will. Similar to this instead of static charts and graphs that present a single viewpoint, interactive visualizations create an explorable digital environment.
This dynamic approach lets users navigate through layers of information with intuitive controls – clicking, hovering, filtering, and zooming in to reveal hidden patterns and correlations. Each interaction peels back new layers of understanding, transforming raw data into meaningful insights.
Why Interactive Data Visualization Matters in WordPress
In the WordPress ecosystem where WooCommerce powers millions of stores and blogs juggle countless insider topics, static tables are no longer enough. Yes! You can go for WordPress tables in their given form. But, is that everything? Interactive data tables and charts aren’t just fancy add-ons—they’re essential tools that transform how your WordPress site communicates complex information. It lets visitors go through rows and columns effortlessly— no hunchback, no squinting on the screen, or tedious manual note-taking required.
So, why do you need interactive data visualization?
***Learn more about dynamic and interactive data visualization to make data easy, engaging, and fun to explore!
Why Choose Ninja Tables to Create Interactive Data Tables
With Ninja Tables, you can make your data visualization more dynamic, advanced, and responsive. Without a doubt, there’s much scope for your data visualization to be ‘the GOAT’. With its powerful features, you can easily create interactive tables and charts that grab attention and work exactly how you need them to.
Under the wide umbrella of interactive and dynamic features, there’s a lot to talk about. Read on to see why you should choose Ninja Tables-
- Advance Sorting and Filtering
- Flexible background and color customization
- Cell styling and font customization
- Stackable and pagination
- Responsiveness
- Multi-media embedding
- Conditional Formatting
- Hover and highlight option
Ninja Tables brings interactivity to life with features that streamline your workflow. Also, Ninja Tables has integrations with WooCommerce, Ninja Charts, and more, while time-saving tools like export-import handle tedious tasks for you. No more manual data transfers—just focus on what truly matters.
How to Create Interactive Data Tables with Ninja Tables
Imagine giving your data the transformation it deserves—no more lifeless rows and columns making viewers scroll away faster than *Game of Thrones* spoilers. Unlike any other table builder plugin Ninja Tables tends to be more interactive, functional, and dynamic.
Our intuitive features let you style cells, customize headers, and add images or icons with ease. Unlike other table builders, Ninja Tables is dynamic, and functional, and puts you in full control. Ready to make your data the star of the show? Let’s see how!
Get started with Ninja Tables
- Go to your WordPress dashboard, navigate to Plugins > Add New, and search for “Ninja Tables”.
- Install and activate the plugin. If you want advanced features, try upgrading to the Pro version for extended functionalities.
Create a new table
- In the WordPress dashboard, go to Ninja Tables > Add Table.
- Give your table a name and add a description if needed. This helps keep things organized, especially if you plan to create multiple tables across sites.
Add data and information
- Add numbers, rows, and columns as you like.
- Simply use the drag-and-drop feature to add texts or any item you want.
- For advanced tables, you can easily click on add columns, and under those, you can add data, and select custom fields for texts, numbers, media, and hyperlinks easily.
- Ninja Tables allows you to format numbers, dates, and text fields to make the data visually consistent and easier to read.
Include interactive data visualization features
- Interactive Data Controls: Enable sorting, filtering, and search functions so users can easily sort through and locate specific data.
| Name | Position | Office | Age | Salary |
|---|---|---|---|---|
| Zorita Serrano | Software Engineer | San Francisco | 56 | $115,000 |
| Zenaida Frank | Software Engineer | New York | 63 | $125,250 |
| Yuri Berry | Chief Marketing Officer (CMO) | New York | 40 | $675,000 |
| Vivian Harrell | Financial Controller | San Francisco | 62 | $452,500 |
| Unity Butler | Marketing Designer | San Francisco | 47 | $85,675 |
| Timothy Mooney | Office Manager | London | 37 | $136,200 |
| Tiger Nixon | System Architect | Edinburgh | 61 | $320,800 |
Also, make tables easily accessible and all the information at reach for any time. Do the work for your viewers.
- Customize Table Appearance: Adjust width, alignment, colors, and fonts to align with your site’s design. You can easily set up a table background by using customized CSS in just one step.
Tips: Get Ninja Tables, pick an image for the table background, and paste the image link with the following CSS:
#footable_parent_NT_ID .foo-table{
background-image: URL(‘_____’);
}
| Image | Name | Category | Price | Quantity | Buy |
|---|---|---|---|---|---|
 | T-Shirt with Logo | Tshirts | Original price was: $10.00.$8.00Current price is: $8.00. | | |
 | T-Shirt | Tshirts | $18.00 | | |
 | Long Sleeve Tee | Tshirts | $25.00 | | |
 | Polo | Tshirts | $20.00 | | |
Also, you can help them out by giving certain selected data points or common regularities a unique appearance with the help of conditional formatting.
| First name | Last Name | Position | Office Branch | Age | Salary |
|---|---|---|---|---|---|
| Ashton | Brady | Accountant | London | 36 | 162,700 |
| Miles | Tenner | Integration Specialist | San Francisco | 41 | 372,000 |
| Harvey | Spencer | Regional Director | London | 42 | 470,600 |
| Mike | Sallanger | Personnel Lead | New York | 38 | 220,500 |
| Jaden | Hyatt | Team Lead | London | 35 | 240,700 |
| Donna | Hannigan | Senior Marketing Designer | San Francisco | 36 | 275,100 |
| Nile | Harris | Development Lead | New York | 37 | 345,200 |
| Allison | Kram | Integration Specialist | Sydney | 34 | 270,000 |
| Victor | Vincent | Accountant | Sydney | 40 | 170,500 |
| Bob | Randell | Accountant | New York | 41 | 190,750 |
- Responsive Design Options: Configure your table for mobile compatibility. To keep tables accessible and visually appealing, you can choose adaptable options like responsive breakpoints to hide, stack, or collapse varying on screen sizes.
- Advanced Media Integration: Add images, videos, and embedded links directly into table cells to create a visually engaging experience.
| Poster | Movie Title | Rating | Trailer | IMDB Link |
|---|---|---|---|---|
 | Minions: The Rise of Gru | 6.6 |  | Learn more |
 | 12 Angry Men | 8.9 |  | Learn more |
 | Pulp Fiction | 8.9 |  | Learn more |
 | The Dark Knight | 9.3 |  | Learn more |
- Animated Hover Effects: Use tooltips to add more context to data points when users hover over them, and apply hover effects for a polished, interactive look.
| Component | Specification |
|---|---|
| CPU | 800 MHz 1 Core ARM v6 |
| GPU | Adreno 200 |
| Chipset | Qualcomm MSM7227 |
| Memory | 278.34 MB |
| ROM | 178.39 MB |
| Network Data | 2G/ 3G / HSDPA 7.2 |
| OS | Android 2.3.7 |
| Screen Size | 3.5 inch |
| Resolution | HVGA (480*320) ~165 ppi pixel density |
| Shot Mode | Single/ Smile / Continuous / Panorama |
| Image |  |
| Mode Name | galaxy s9 plus |
| Brand Name | Samsung |
- Highlight and Comparison: Show different pricing plans, packages, and products in comparison tables. You can easily highlight the options you want viewers to focus on. Give comparing features for users to delve deeper into and flexibility to analyze.
Features | Ninja Tables | TablePress |
Unlimited data | ||
Media attachment | ||
WooCommerce product table | ||
Drag & drop table builder | ||
Google Sheets Auto-sync | ||
Sort and filter | ||
Fluent Forms integration | ||
Charts | ||
Conditional formatting | ||
Pre-built templates | ||
Frontend editing | ||
Cell merge |
Explore Ninja Tables free templates your way and preview designs with interactive features directly on our templates page!
Watch Full Processing: Interactive Data Visualization With Ninja Tables
What sets modern WordPress tables plugin apart is their ability to handle large datasets without sacrificing performance, thanks to efficient stackable pagination and customized CSS flexibility. Interactive tables simplify complex data into actionable insights—all while keeping your WordPress site fast and responsive.
Here’s a whole lot more on today’s topic ‘Interactive data tables’ and a lot of bases to touch on. Watch the process- from installation to responsiveness, in our dedicated YouTube tutorial playlist.
Interactive Data Charts with Ninja Charts
With built-in data synchronization, ready-made components, and completely customizable options, Ninja Charts does all the heavy lifting out of the box, saving you valuable time on your interactive data visualization needs. Here we’ve gathered some interactive charts examples for you to get inspired from.
Line Chart
Pie Chart
Bar Chart
Horizontal Bar
Bubble Chart
Doughnut Chart
Scatter Chart
Explore the 7 best data comparison charts and see how interactive visualization tools stand out.
Wrapping It Up: Your Data, Your Way
Interactive tables and charts aren’t just eye candy—they’re functional. With Ninja Tables, you’re not stuck with lifeless grids; you’re creating dynamic, user-friendly experiences that make exploring data a breeze. From real-time updates to stunning visuals, it’s all about giving your audience the tools to uncover insights their way.
So, why settle for out-of-date, static presentations? Begin realizing the full power of interactive data visualization today.
Ninja Tables allows you to create tables beyond static grids by including advanced sorting, filtering, conditional formatting, multimedia embeds, and adaptable designs optimized for each device. Ninja Charts goes further, converting your table data into slick, customizable charts such as pie charts, bar graphs, and scatter plots with only a few clicks.
Are you ready to take the leap? Let your data shine!
Ninja Tables– Easiest Table Plugin in WordPress







Add your first comment to this post