Showcasing Profile: Creating a Professional Portfolio Table in WordPress
Your portfolio is your proof of work. It’s the difference between “I can do this” and “I’ve done this.” However, most professionals struggle with a fundamental issue: how to display dozens of projects in a way that’s both comprehensive and easy to navigate.
Traditional portfolio layouts, endless grids of thumbnails, long scrolling pages, or separate project pages force visitors to hunt for information. If clients can’t find what they need fast, they’ll move on to someone easier to browse.
Portfolio tables in WordPress solve this problem elegantly. By organizing your work into sortable, filterable tables, you create a portfolio that’s powerful and instantly searchable. Tools like Ninja Tables make this approach accessible without requiring technical expertise or custom development.
In this guide, we’ll explore why portfolio tables are revolutionizing professional online presence and how you can leverage Ninja Tables to stand out in your industry.
Why Portfolio Tables Outperform Traditional Layouts
Most professionals present their work in one of three ways: image galleries that look nice but hide information, lengthy case study pages that overwhelm visitors, or simple lists that lack visual appeal. None of these formats balances comprehensive information with easy navigation.
Professional portfolio tables change the game by displaying multiple data points simultaneously. Visitors see project names, client types, technologies, dates, and results in one scannable view. They can sort by date to see your latest work, filter by industry to find relevant experience, or search by technology to assess your technical skills.
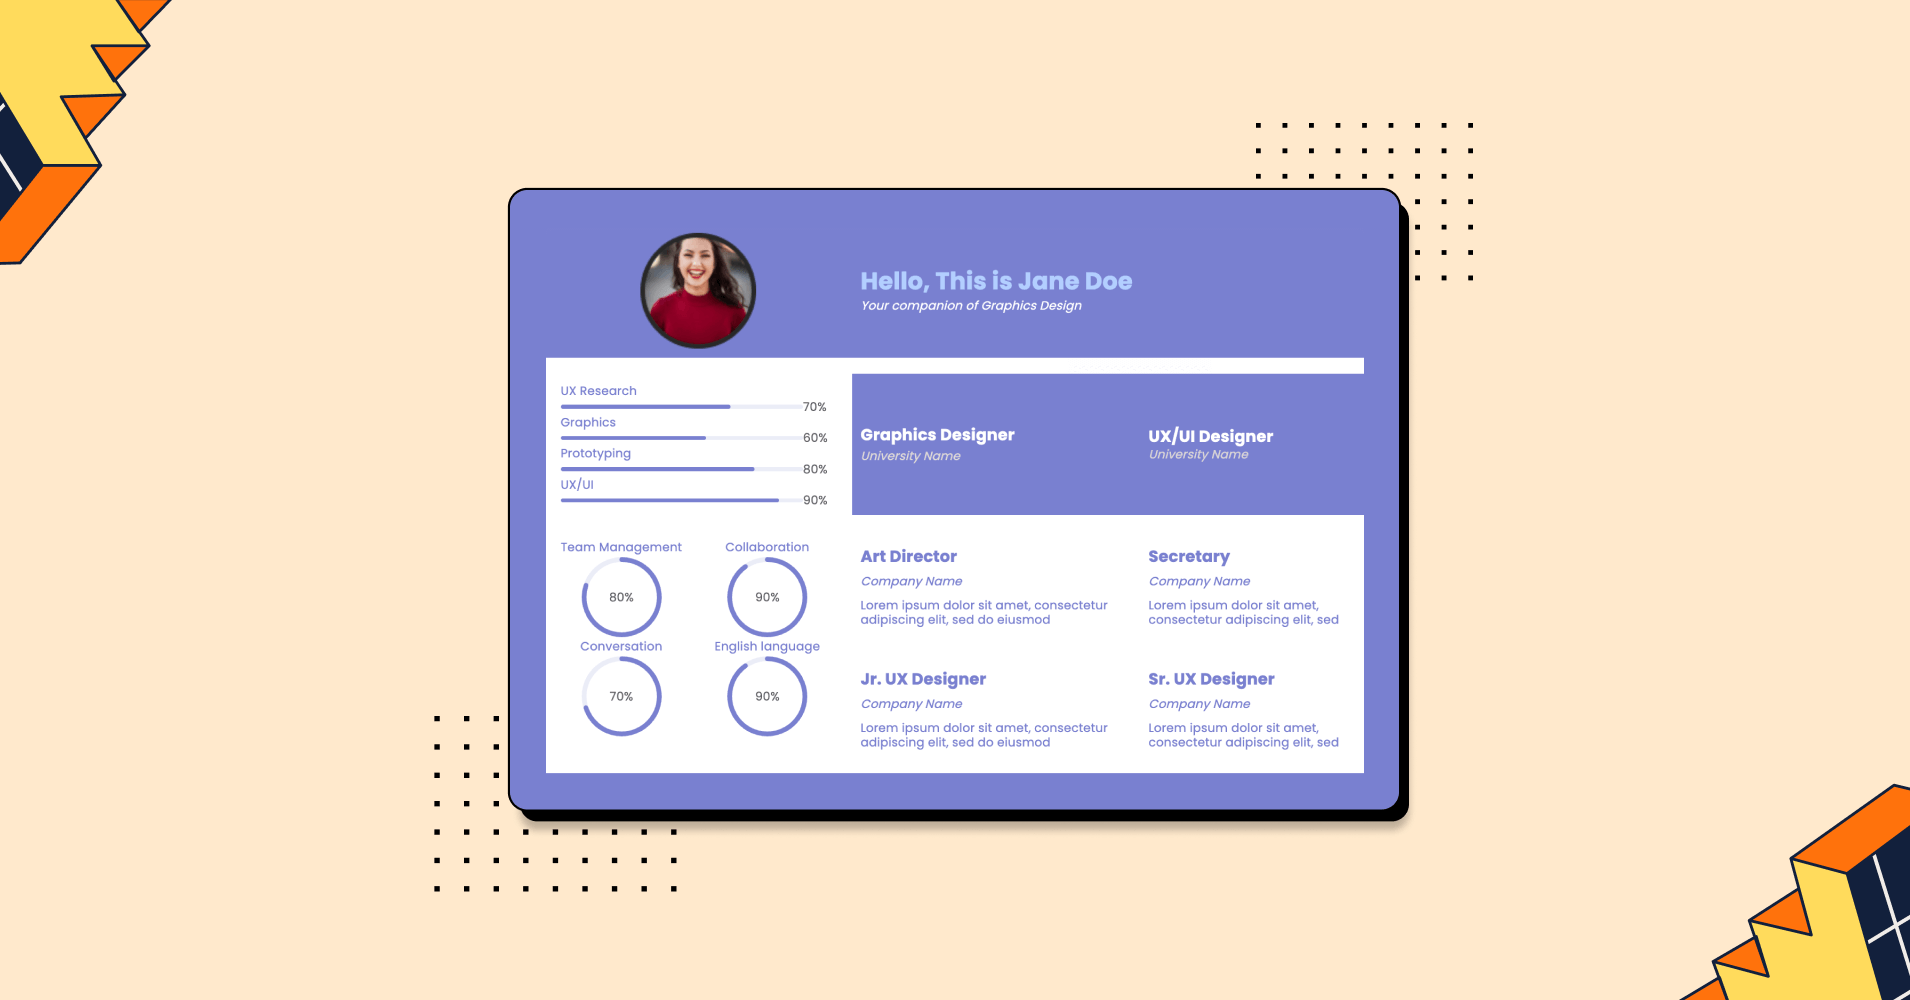
 | Hello, This is Jane Doe Your companion of Graphics Design | ||||
UX Research 70% Graphics 60% Prototyping 80% UX/UI 90% | Graphics Designer University Name | UX/UI Designer University Name | |||
Team Management 80% Conversation 70% | Collaboration 90% English language 90% | Art Director Company Name Lorem ipsum dolor sit amet, consectetur adipiscing elit, sed do eiusmod | Secretary Company Name Lorem ipsum dolor sit amet, consectetur adipiscing elit, sed | ||
Jr. UX Designer Company Name Lorem ipsum dolor sit amet, consectetur adipiscing elit, sed do eiusmod | Sr. UX Designer Company Name Lorem ipsum dolor sit amet, consectetur adipiscing elit, sed | ||||

This structured approach does something subtle but powerful: it makes extensive portfolios feel manageable rather than overwhelming. A gallery of 50 projects feels cluttered. A searchable table of 50 projects demonstrates experience and versatility.
The format also shapes perception. A well-organized table signals professionalism and attention to detail before visitors even read your content. For client-facing professionals, this first impression matters. Now, let’s break down what makes these tables actually work.
Tools like Ninja Tables make this approach accessible without requiring technical expertise or custom development. Whether you’re a developer, designer, marketer, or consultant, you can create professional portfolio tables that adapt to your specific needs.
Core Portfolio Table Contents
The best portfolio tables share common structural elements that make them functional and professional.
- Visual anchors matter first. Even data-heavy tables need visual interest. Project thumbnails or client logos provide quick recognition and break up text density.
- Strategic information hierarchy comes next. Think of your table like a newspaper: headlines grab attention, but body text provides depth.
- Functional interactivity transforms static displays into tools. Sorting and filtering are essential for portfolios with more than 10-15 projects. Visitors should be able to reorganize your work by date, project type, or client industry without friction.
- Action pathways connect your table to deeper content. Whether linking to detailed case studies, live project URLs, or demo videos, your table should guide engaged visitors toward more comprehensive information about projects that interest them.
Types of Portfolio Tables for Different Needs
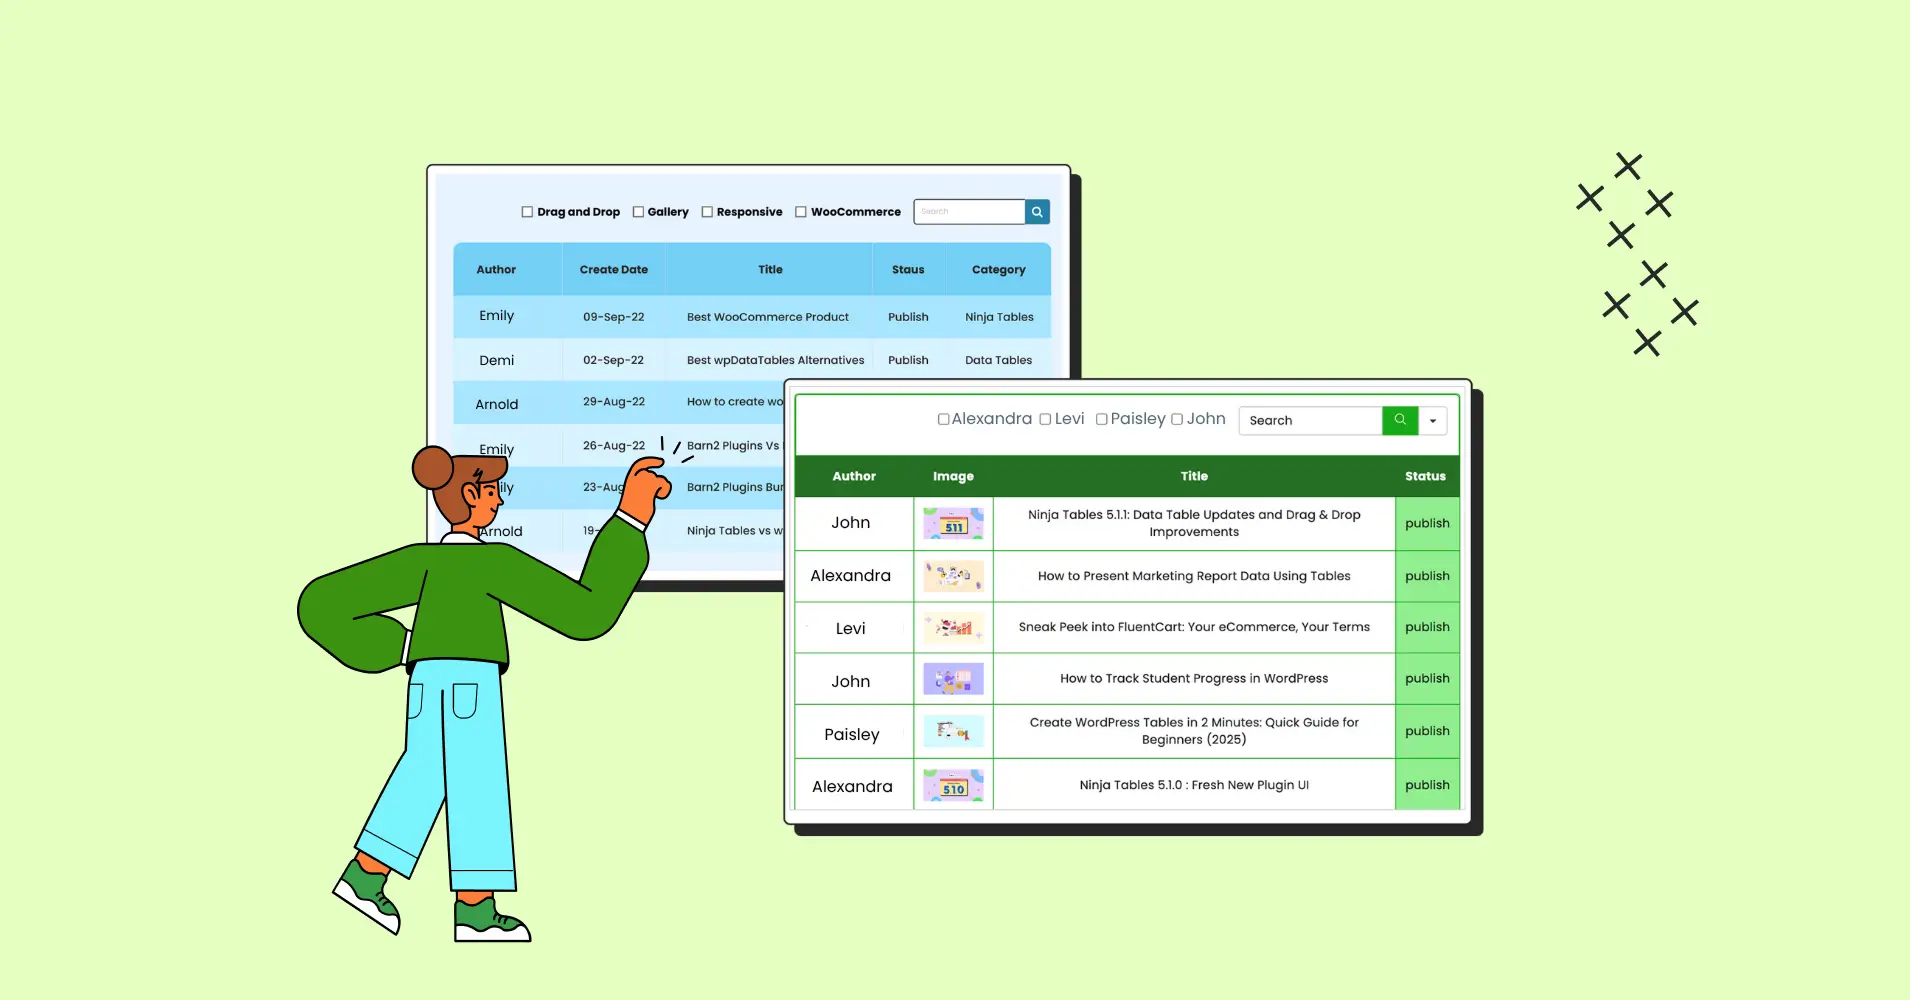
Portfolio tables aren’t one-size-fits-all. Different professional profile contexts call for different approaches. Here are some example of WordPress portfolio tables right in action!
Project-focused tables work well for freelancers and agencies showcasing completed work. These emphasize individual projects with details about scope, deliverables, technologies, and measurable outcomes. It also helps align project portfolio management with specific results.
CineLogica Project Progression Tracker | |||||
Total Project Hours 100% Wireframing Time 15% UI Design Time 30% UX Research & Flow Mapping 18% Prototype Completion 18% Iteration Hours 12% | Project Type UI/UX Optimization Start Date 30 June, 2025 Deadline 28 July, 2025 | Project Status Active Priority Level High | |||
Project Delivery Rate 95% Feedback Implementation Rate 82% | Design Consistency 92% Prototype Approval Rate 96% | UI/UX Project Focus Information Architecture
| Visual Design
| ||
Wireframing & Prototyping
| Most Time-Consuming Element
| ||||
Skills-based tables serve professionals, highlighting capabilities across multiple areas. Rather than organizing by project, these tables categorize by service type, methodology, or technical skill, with examples supporting each capability. This works particularly well for consultants or specialists with deep expertise in specific areas.
Core Skills & Offerings | |
Narrative Writing Crafts immersive long-form stories, profiles, and essays that blend emotion with depth. Every piece is rooted in strong storytelling and narrative flow. | Editorial Strategy Develops editorial calendars, content frameworks, and publication strategies for digital and print media—aligning creativity with audience intent. |
Cultural Analysis Explores the intersections of fashion, art, and modern culture with analytical precision. Turns observations into thought-provoking commentary and columns. | Brand Storytelling Transforms brand messages into engaging human stories through tone, structure, and emotion—merging journalism with marketing insight. |
Client-centric tables prioritize relationship and industry information. These work for B2B professionals where potential clients care more about who you’ve worked with and in what industries than about specific project details. Testimonials, company logos, and industry tags take priority over technical specifications.
Client Collaboration Overview | ||
Zenith Corp |  BlueOrbit Agency |  Nova Realty |
Industry: FinTech | Industry: Marketing | Industry: Real Estate |
Focus: API Integration Dashboard | Focus: Campaign Performance Analytics | Focus: Dynamic Listings Visualization |
Outcome: Boosted data visibility by 70% | Outcome: Reduced report generation time by 60% | Outcome: Increased user engagement by 45% |
Testimonial “Seamless data organization and visualization.” | Testimonial “Perfect blend of aesthetics and clarity.” | Testimonial “Clean, modern, and incredibly intuitive.” |
Results-driven tables center on quantifiable outcomes. These tables lead with metrics- revenue increases, user growth, efficiency improvements, or cost savings, making them ideal for marketing professionals, growth specialists, and anyone whose work produces measurable business impact.
BlueOrbit Result Overview | |||||
Revenue Growth 70k 13% | User Increase 82% +17 pts | Cost Reduction -22% $2.3k Less | |||
Campaign Performance | |||||
Campaign | ROI | Goal Achievement | |||
Summer Growth Push | +78% | 75% Revenue Target | 86% Customer Retention | 95% Campaign Efficiency | |
Email Revive | +42% | ||||
Automation Setup | 2hrs/week save | ||||
Real-World Applications Across Industries
Portfolio tables aren’t just for one type of professional. Let’s explore how different industries can leverage this approach.
WordPress portfolio for developers
Developers can showcase projects with columns for technologies used, GitHub links, project scale (lines of code, users, traffic handled), and performance metrics. The ability to filter by programming language or framework helps potential employers or clients quickly assess relevant experience.
Technical professionals might include columns for architecture patterns, testing coverage, or deployment environments; details that resonate with technical audiences evaluating expertise depth.
Creative and design portfolio
Designers benefit from visually-rich tables that prioritize project thumbnails while including information about client industries, project types (branding, web design, print, etc.), and measurable outcomes where applicable (increased engagement, conversion rates, etc.)
The filtering capability allows designers with diverse portfolios to let potential clients self-select for relevant work, whether that’s minimalist corporate identity or vibrant consumer packaging.
Marketing and growth professionals
Marketers can create compelling portfolio tables centered on results. Columns might include campaign types, channels utilized, budget ranges, and most importantly, measurable outcomes like ROAS, conversion rate improvements, or audience growth percentages.
This data-driven presentation aligns perfectly with how marketing decisions are made, demonstrating not just what you’ve done but the business impact you’ve delivered.
 Jane Doe Product Manager | Expertise: Strategizing, SEO, Graphics Designing, Team Management | |
Consultants and service providers
Consultants across industries can use portfolio tables to showcase client industries, problem types solved, methodologies employed, and qualitative or quantitative outcomes. The structured format helps potential clients find relevant case studies quickly.
Including project duration and team size provides context about project scale and your role, building realistic expectations about engagement types.
Content creators and writers
Writers, videographers, podcasters, and other content creators can organize their work by content type, publication or platform, audience size, engagement metrics, and topic areas. This is particularly valuable for creators with extensive back catalogs spanning diverse subjects.
Links to actual content combined with metrics like views, shares, or time spent create a compelling, evidence-based portfolio.
The Power of Portfolio Tables
Portfolio tables represent a paradigm shift in how professionals present their work online. Think of them as the evolution from a filing cabinet to a sophisticated database—everything is still there, but suddenly it’s organized, searchable, and instantly accessible.
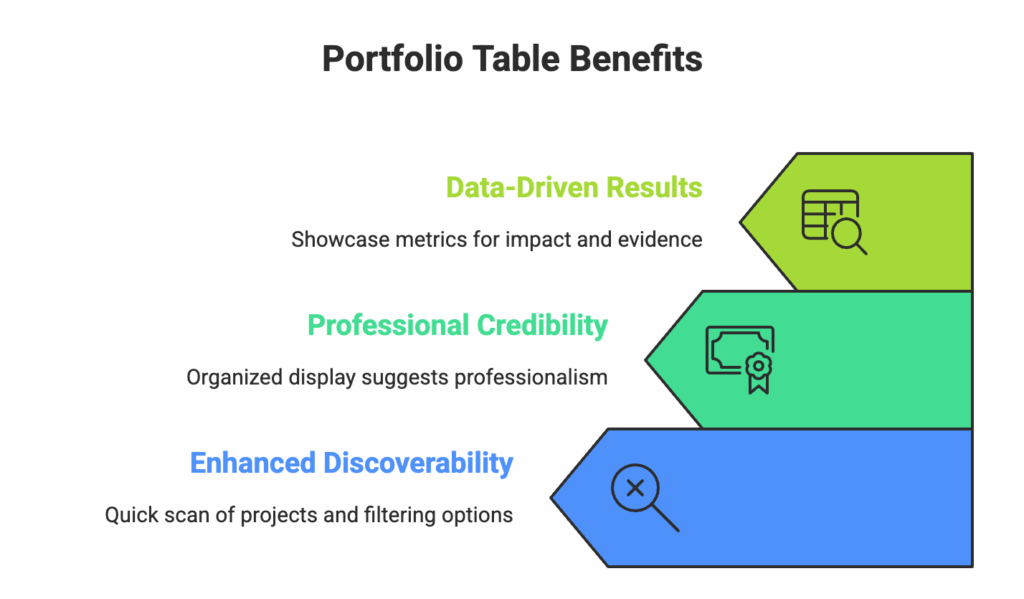
Enhanced discoverability
When your portfolio exists as a structured table, visitors can instantly scan multiple projects simultaneously. They see your project names, client types, technologies used, completion dates, and results all in a single coherent view. This bird’s-eye perspective allows potential clients to quickly identify relevant work that matches their needs.
Modern portfolio tables go far beyond static displays.
Each dynamic functionality transforms how people interact with extensive portfolios. Professionals with dozens or hundreds of projects no longer need to curate separate landing pages for different industries or services. A single, well-structured portfolio table with robust search capabilities serves all audiences effectively.
Professional credibility
There’s an often-overlooked psychological aspect to portfolio presentation. When potential clients see a meticulously organized, professionally structured display of your work, they make immediate assumptions about how you operate. A cluttered, difficult-to-navigate portfolio suggests disorganization.
This perception extends to scale as well. A table that elegantly displays 50+ projects communicates experience and demand. The same 50 projects in a gallery format can feel overwhelming rather than impressive. The format itself shapes the perception.
Data-driven presentation
Tables excel at displaying quantitative information and quantitative results are what convert browsers into clients. When you can showcase metrics like “45% increase in conversion rates,” “10,000+ users,” or “$2M in revenue generated” alongside project descriptions in a scannable format, you’re not just showing what you did—you’re proving your impact.
This structured approach to presenting outcomes aligns perfectly with how decision-makers evaluate potential partners or hires. They’re looking for evidence, and tables make that evidence immediately visible and comparable across projects.
Conclusion
A well-crafted portfolio table isn’t just a display of past work; it’s a professional infrastructure that actively works for you. It guides qualified prospects to the evidence they need, makes extensive experience feel accessible rather than overwhelming, and positions you as organized and detail-oriented before prospects even contact you.
Start with your strongest 15-20 projects. Build a clean, functional table that showcases these effectively. Then commit to consistent growth, adding projects as you complete them, refining based on visitor feedback, and evolving your structure as your career progresses.
The investment compounds over time. Every completed project becomes an easily integrated entry in your growing body of evidence. Within months, you’ll have a portfolio that doesn’t just represent your work—it becomes one of your most effective business development tools.
Ninja Tables– Easiest Table Plugin in WordPress


Add your first comment to this post