Average Order Value (AOV): Definition, Formula, and Strategies
Your eCommerce store is getting traffic. Sales look decent, but something feels off with your revenue. You realize the problem isn’t how many people are buying. It’s actually how much each customer spends when they buy.
This is where Average Order Value (AOV) becomes one of the most important ecommerce metrics. By increasing how much customers spend per order, businesses can improve revenue and profitability without relying on new traffic.
This guide breaks down what AOV means, why it deserves a spot in your regular reporting, how to calculate it, and practical strategies to improve AOV in your online store.
What Is Average Order Value (AOV)?
Average Order Value (AOV) is an ecommerce metric that measures the average revenue generated per order in an online store. It is calculated by dividing the total revenue by the number of orders placed during a specific period.
AOV Formula:
Average Order Value = Total Revenue / Total Number of Orders
For example:
- Total revenue: $10,000
- Total orders: 200
Average Order Value = $10,000 ÷ 200 = $50
This means the average customer spends $50 per order.
That single number tells you a lot of things you wouldn’t have guessed otherwise:
- How your customers respond to your pricing
- Whether upselling is working
- Where your revenue ceiling is
- Customer purchasing behaviour
- Whether to encourage larger purchases
Most businesses track AOV monthly, but you can measure it over any time period — weekly during a sale event, quarterly for broader trend analysis, or annually to spot seasonal shifts.
Important note: AOV doesn’t track how often someone buys (that’s purchase frequency) or how much they spend over their lifetime (that’s customer lifetime value). But all three metrics are deeply connected, and improving AOV tends to have a positive ripple effect across the others.
AOV vs ASP vs LTV (CLV)
AOV = Average order value
ASP = Average selling price
LTV (CLV) = Customer lifetime value
All three metrics are relevant to eCommerce but they measure different things.
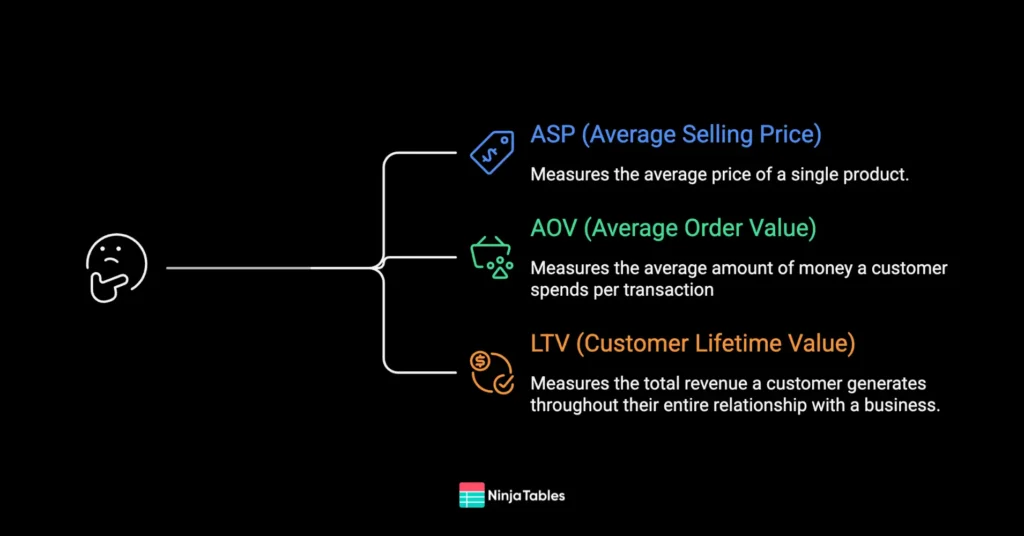
ASP measures the average price of a single product sold. LTV measures the total revenue a customer generates throughout their entire relationship with a business. And AOV measures the average total value of a customer’s entire order.
ASP and AOV: If a customer buys three items worth $20 each, the ASP is $20, while the AOV becomes $60 because the order includes multiple products.
LTV and AOV: If a customer spends $60 per order and places 5 orders over a year, the AOV is $60, while the LTV becomes $300 because it reflects the total revenue generated from that customer over time.
Put together all three, you can tell how customers spend, how much they spend per order, and how valuable they are over time.
Why Average Order Value Matters for eCommerce
Most eCommerce stores focus on increasing traffic, ad campaigns, and acquisitions. All of these cost money and time.
Improving AOV, on the other hand, works with the customers you already have. It allows businesses to generate more revenue from the same number of existing customers.
An increase in average order value, even the smallest increase, from $35 to $42 per order, can translate into thousands of additional dollars in monthly revenue without spending on new customers.
A higher AOV increases return on investment (ROI) because each customer generates more revenue.
Reasons why improving AOV is important.
- Higher revenue without focusing on traffic
- Better ROI
- Stronger profit margins
- Deeper insight into customer behaviour
There’s also a transaction cost angle to consider.
Tracking AOV regularly helps you evaluate whether your pricing strategy, promotions, and product presentation are actually working. If you run a bundle deal and your AOV doesn’t move, that’s useful information. If a free shipping threshold causes a noticeable uptick, you’ve found something worth scaling.
What Is a Good Average Order Value?
AOV varies significantly by industry, product category, and price point, so there’s no single “good” number that applies across the board. A store selling $8 phone cases will naturally have a lower AOV than one selling $200 skincare sets, even if both are performing well.
The more important benchmark is your own historical AOV.
If your store has been averaging $38 for the past six months and jumps to $47 after a strategic change, that’s a meaningful improvement regardless of where you sit relative to an industry average.
How to Track Average Order Value
It’s simple to calculate average order value. But the real value comes from tracking AOV consistently over time. A single data point tells you your current state.
A table of monthly AOV figures tells you whether things are improving, declining, or staying flat — and often gives you clues as to why.
Here’s what a basic AOV tracking table might look like for an eCommerce store:
| Month | Total Revenue | Total Orders | Average Order Value | AOV Change |
|---|---|---|---|---|
| January | 14200 | 440 | 32.27 | _
|
| February | 15800 | 460 | 34.35 | +2.08
|
| March | 19500 | 510 | 38.24 | +3.89
|
| April | 17100 | 490 | 34.9 | - 3.34 |
| May | 22300 | 530 | 42.08 | +7.18
|
| June | $20,600 | 540 | $38.15 | -$3.93 |
When you can see this kind of data laid out cleanly, patterns emerge that you’d completely miss by glancing at a single metric. The spike in May, for example, might correspond with a bundle promotion you launched. The dip in April might point to a discount campaign that drove volume but hurt per-order value.
How to Increase Average Order Value: 7 Strategies
There are dozens of tactics you’ll find written about, but most of them fall into a smaller set of core strategies that actually move the needle. The only goal is to help customers discover additional products or upgrades that enhance their purchase.
Below are 7 strategies to improve AOV.
1. Set a free shipping threshold
Free shipping is one of the most powerful AOV motivators in ecommerce.
When customers know they’re just $10–$15 away from qualifying, many will actively look for something to add to their cart. The key is setting the threshold slightly above your current AOV. High enough to encourage an extra add-on, but not so high it feels unattainable.
If your current AOV is $38, a free shipping threshold at $50 is a natural nudge.
“Get free shipping by adding $12 more!” – this simple message showing up clearly on product pages, in the cart, and at checkout will encourage customers to buy more.
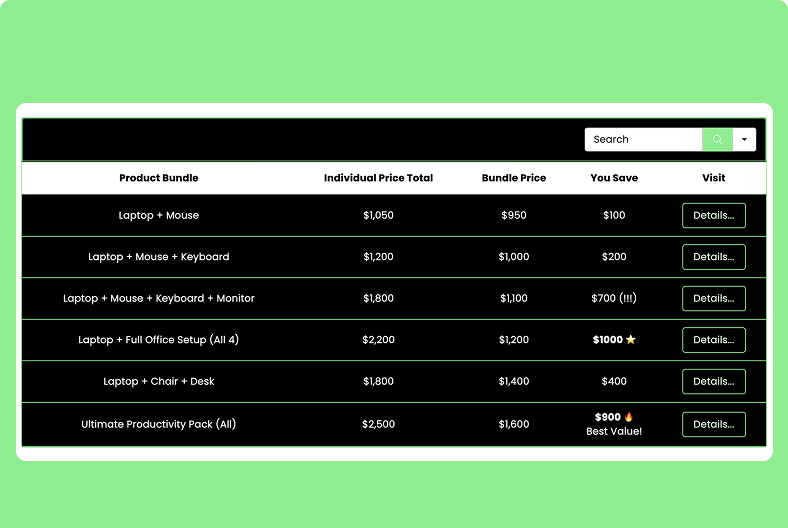
2. Bundle products
Product bundling is one of the most reliable ways to increase average order value because it reframes the purchase decision. Instead of asking a customer to buy one thing, you’re offering them a package that delivers more value at a price that feels like a deal.
Bundles work well when they solve a complete problem: a skincare starter kit, a home office setup, a home gym set.

Bundled products will bring higher AOV because the customer doesn’t have to think about what else they might need; you’ve done that work for them.
3. Upsells and cross-sells
Upselling means guiding a customer toward a higher-value version of the product they’re buying and cross-selling means recommending complementary products that pair well with what’s in their cart.
- Recommending a laptop with higher RAM to someone who is buying a laptop is a good upsell.
- And recommending a keyboard to this person is proper cross-selling.
→ But recommending a kitchen gadget to the same person is irrelevant.
When the recommendation feels natural it feels like helpful guidance instead of a sales push, and conversion rates reflect that.
Product tables and comparison tables are particularly effective for upselling because they show features side by side.
Table Examples for Upselling

Comparison with tier
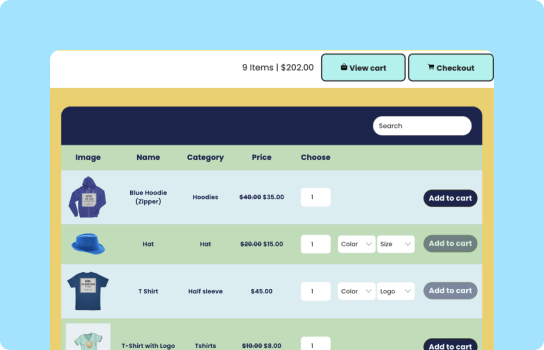
WooCommerce table
Products side-by-side

3 column comparison
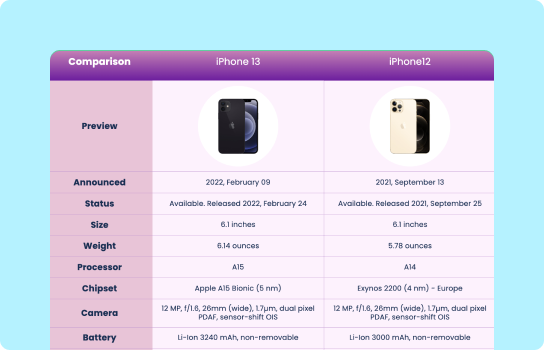
Product comparison
Customers can quickly evaluate the benefits of higher-tier options and choose the one that offers the best value.
4. Discounts and promotions
You can try and have fun with a lot of options (but not all at the same time!).
Volume discounts
The psychological effect of “Buy 2, get 10% off” or “Buy 4, get 20% off” gets customers to buy more just to unlock the discount privilege.
Promotional offers
Customers increase their cart value when promotions are tied to spending thresholds.
Examples include:
- Spend $100 and receive a discount
- Buy 2, get 1 free
- tiered pricing discounts
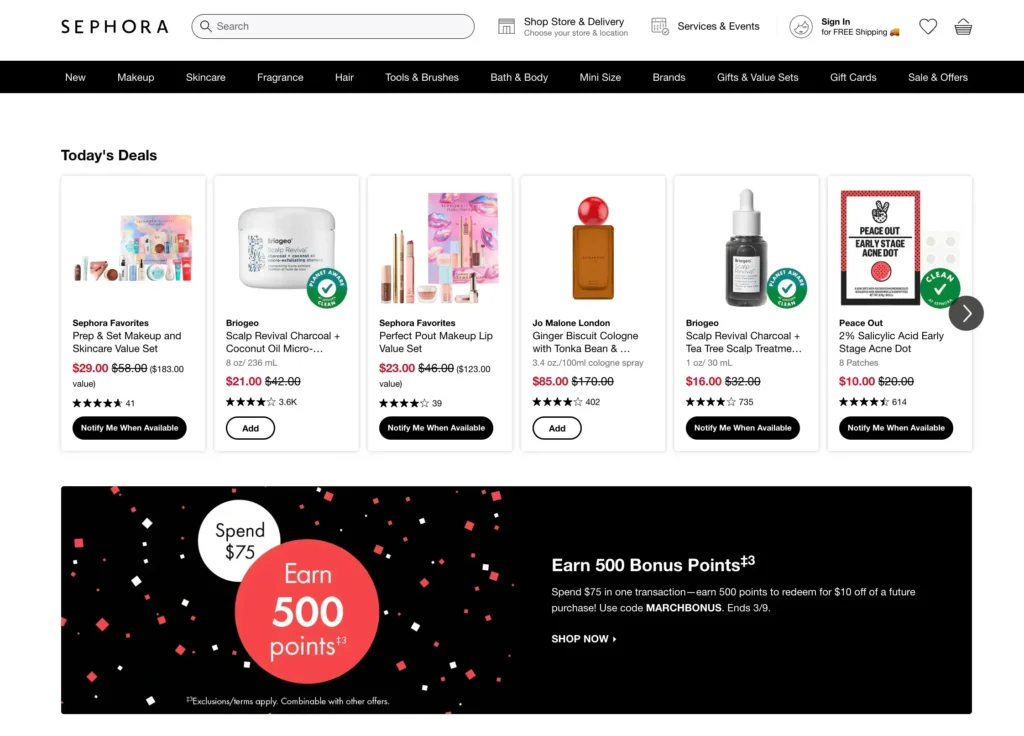
A clean, scannable deals and discounts table embedded on your product or promotions page makes volume pricing easy to understand.
Deals and Discounts Tables
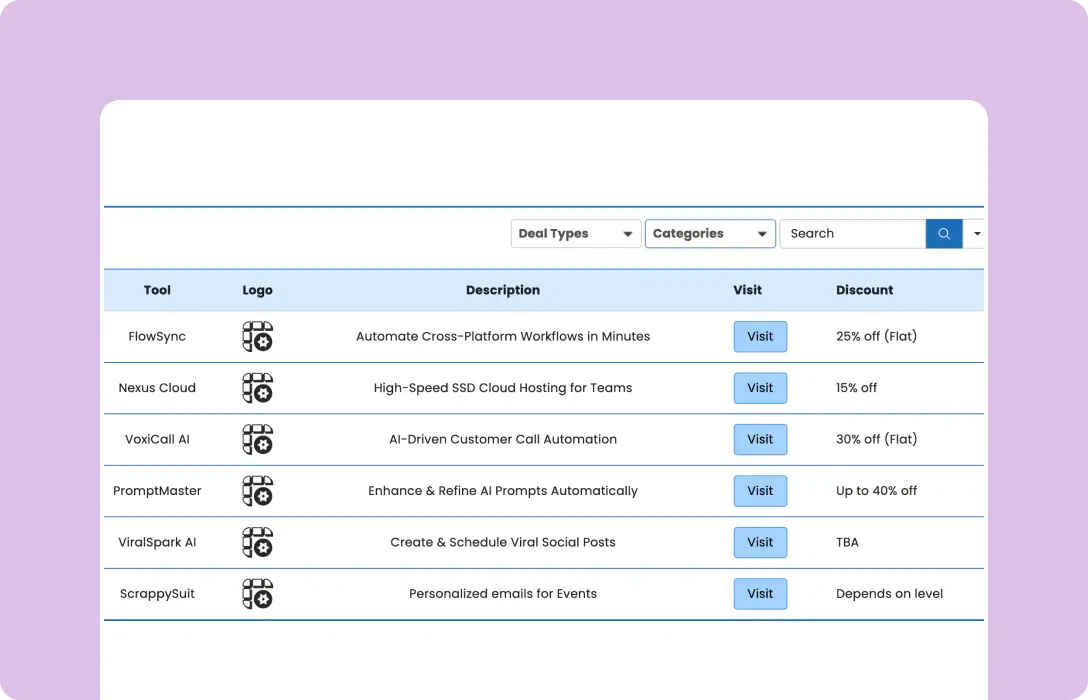
Best Deals Listing
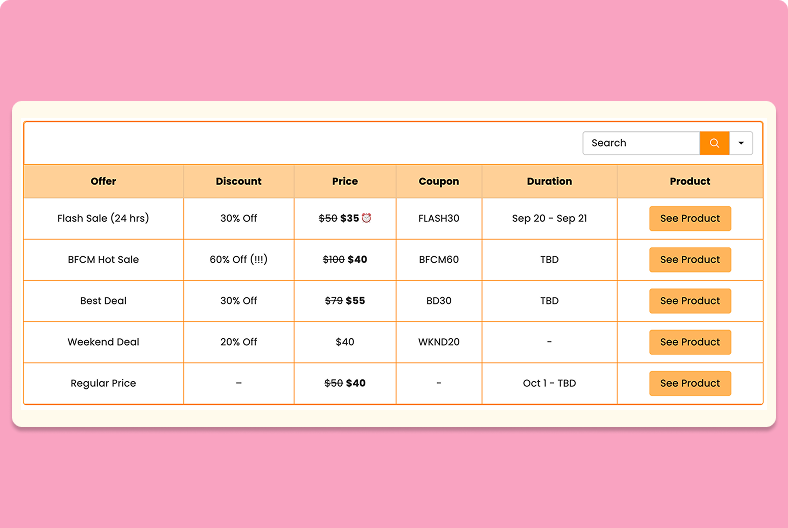
Limited Time Discount
Bundle Discount
FOMO or limited-time offers
Urgency motivates customers to complete purchases quickly and often encourages them to add more items before checkout.
Examples:
- limited-time discounts
- flash sales
- countdown promotions
FOMO marketing strategies explain how urgency can drive conversions.
5. Loyalty program or minimum spend incentive
Loyalty programs create a compelling reason for customers to consolidate their purchases with you rather than splitting orders across multiple stores.
Here are some tips that can encourage customers to spend a bit more per order and get to the next reward tier.
- Points that accumulate toward a reward
- Milestone-based perks
- Exclusive member pricing
- Discount offer due to referrals
Or, introducing a minimum spend coupon: “Save $10 by spending $75.”
These drive both AOV on the current purchase and give customers a reason to return. Learn personalized marketing strategies like loyalty programs that keep customers engaged beyond the first transaction.
6. Reduce cart abandonment
Cart abandonment affects overall revenue and average order value. Customers sometimes leave when the checkout experience becomes confusing or when unexpected costs appear.
Recovery strategies like the following can help:
- Exit-intent popups
- Abandoned cart emails
- Retargeting campaigns
- Discount on saved cart
- Order complete discount
When you recover a $90 cart that was about to disappear, that’s a direct AOV win.
Personalization increases AOV by tailoring cart recovery emails, popups, offers, and retargeting efforts to each customer.
7. Optimize the customer journey
If your highest-value products are buried in navigation, or if your checkout flow doesn’t show related items at the right moment, customers simply won’t encounter the purchase options that would naturally increase their order value.
But, customers tend to spend more when the shopping experience feels smooth and intuitive. You can be pushing random products with every scroll or swipe.
Mapping and optimizing the ecommerce customer journey helps you identify where customers are dropping off, which product pages they’re visiting, and whether the path from discovery to checkout is surfacing your best opportunities for order value growth.
Get in touch with Ninja Tables
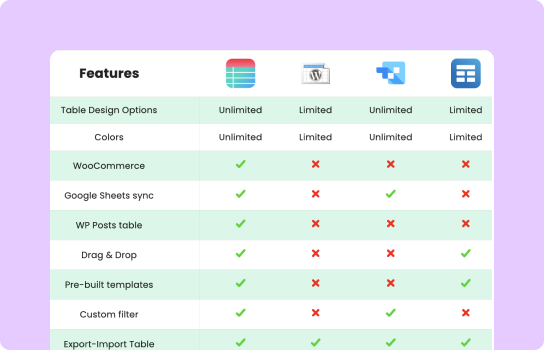
How Ninja Tables Helps Track and Display AOV Data
Many store owners track AOV across spreadsheets, analytics dashboards, and reports, which makes it harder to see trends clearly.
Ninja Tables lets you build interactive data tables in WordPress, which means you can create a dedicated AOV tracking table and update monthly without leaving WordPress dashboard.
You can set up tables that display:
- Monthly AOV trends with conditional formatting to highlight improvement
- AOV by product category to see which segments are driving value
- Campaign performance showing AOV before and after a promotion
- Order value distribution to understand how many orders fall above vs. below your AOV target
Even before the tracking phase, Ninja Tables creates various styles of product comparison tables, pricing tables, review tables, etc. that help customers decide their purchasing plan.
For FluentCart or WooCommerce stores focused on increasing conversion rates alongside order value, having this kind of data well-organized makes the difference between guessing and making informed decisions.
Common AOV Mistakes to Avoid
Even with the right strategies in place, a few common missteps can undermine your progress.
Chasing AOV while ignoring conversion rate. If upselling tactics are too aggressive or thresholds are too high, customers may leave. A higher AOV means nothing if fewer orders are completed.
Discounting so heavily that margin shrinks. Volume discounts and coupons can increase AOV, but large discounts can also reduce profit. Know your numbers before setting discount tiers.
Recommending irrelevant products. Cross-sells and upsells that don’t connect to what’s already in the cart frustrate customers. Be careful with your product recommendation strategy.
Treating AOV as a one-time project. AOV optimization is an ongoing process. Seasonal shifts, new product additions, pricing changes, and customer behavior all affect it.
FAQs
What is average order value?
Average order value (AOV) measures the average amount customers spend each time they place an order on an ecommerce store.
How do you calculate average order value?
AOV is calculated using the formula: Total Revenue ÷ Number of Orders
How can you increase average order value?
Businesses increase AOV through strategies such as upselling, cross-selling, product bundles, discounts, and improved product presentation.
What is ASP and AOV?
ASP is average selling price and it’s the metric to measure the average price of a single product sold. And AOV is average order value is the average amount of money a customer spends per transaction in your store.
What is LTV and AOV?
LTV is lifetime value of a customer and it measures the total revenue generated by a business from a customer throughout the entire relationship. And AOV is average order vlaue that measures the total average dollar amount in a transaction.
Key Takeaways
Average Order Value is a metric that rewards consistency. You calculate it once, it’s just a number. You track it monthly and act on the trends, it becomes a genuine growth engine.
The formula is simple: total revenue divided by total orders. The real work is in understanding what’s driving that number and taking some steps – setting a free shipping threshold, building a bundle page, upselling/cross-selling, strategic discount offers, mapping customer journey, and more.
When ecommerce stores focus on improving product discovery and customer experience, increasing average order value becomes a natural outcome. Over time, these improvements help businesses generate more revenue while delivering better value to their customers.
If you’re ready to take a more structured approach to your ecommerce data and grow your business with better WordPress tables, Ninja Tables gives you the tools to display, organize, and act on the numbers that matter most.
Ninja Tables– Easiest Table Plugin in WordPress


Add your first comment to this post