
Create Charts in WordPress With a Free Charts Plugin
Among many ways of engaging the audience, adding charts and graphs in WordPress blogs is one of the smartest. If WordPress tables are your go-to solution for structured data display, you’re in luck!
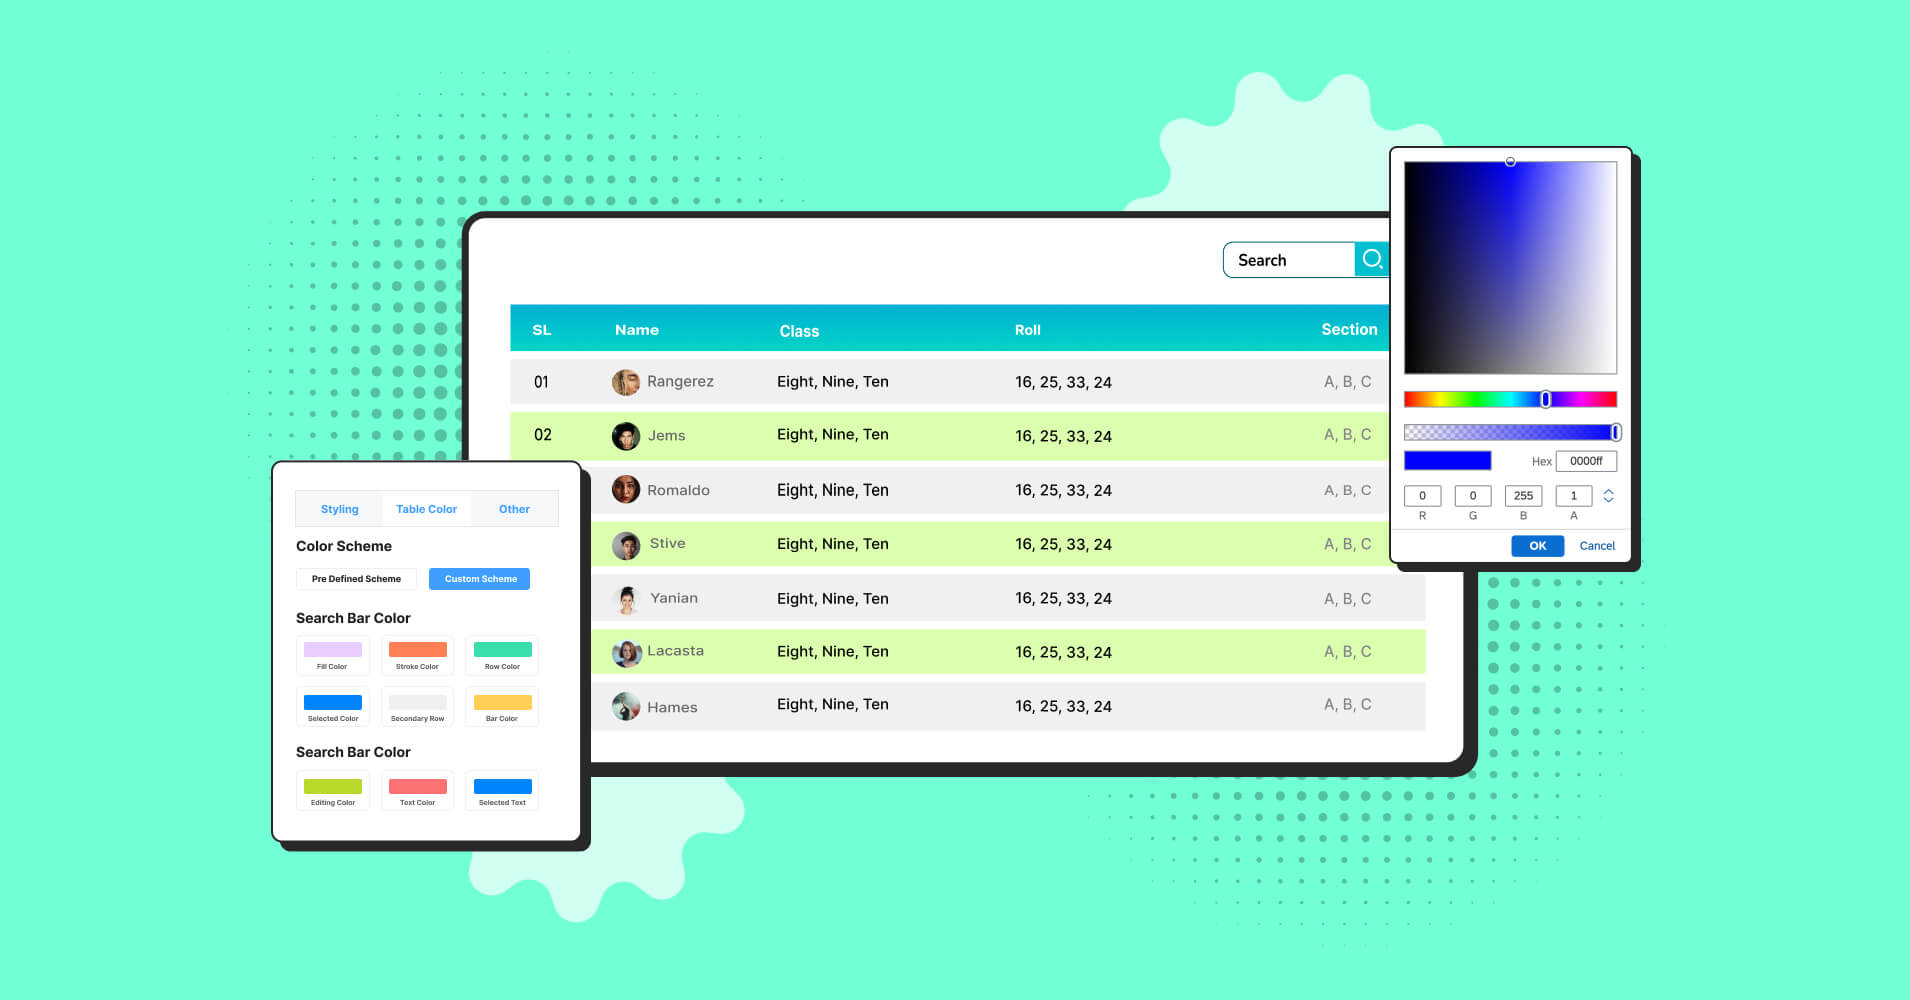
Create a chart from a table in WordPress using quality table plugins that integrate the charts addon.
If you’re wondering about how to convert a table into chart, stop fretting over it. We got everything covered. Firstly, you’ll need a table plugin with chart integration on your dashboard.
How to create a chart using a WordPress table plugin
We can drop several names of WordPress chart plugins for you. But we’re focusing more on explaining how chart creation works with a table plugin. Of course, you can find a plugin of your choice on your own.
However, in this article, we have chosen Ninja Tables.
One of the many reasons we’re going with Ninja Tables is that it directly integrates with Ninja Charts, a free WordPress Charts Plugin. So, creating charts with table data takes no time!
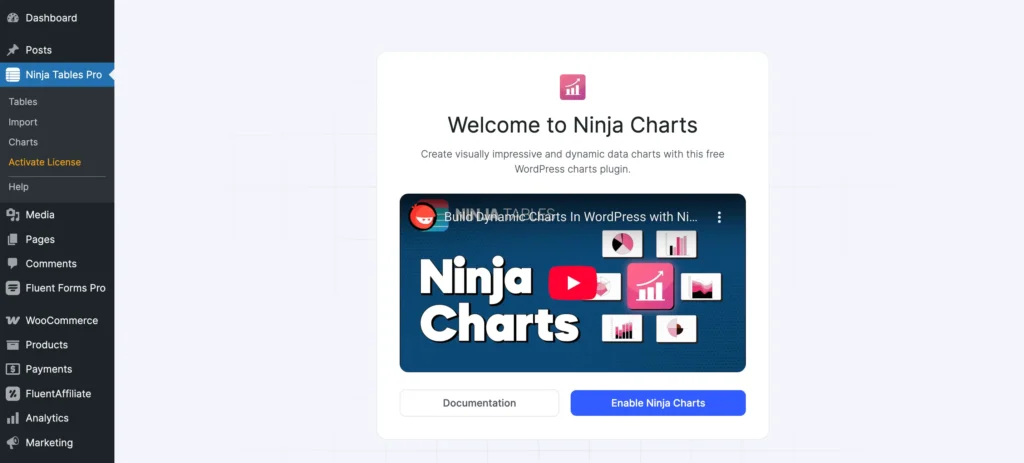
Before we get into the details, install and activate Ninja Tables and Ninja Charts on your dashboard. The charts addon will automatically connect with the table plugin.
Ninja Charts works in Ninja Tables Free version too!
Now, follow these steps to create a chart from a table in Ninja Tables.
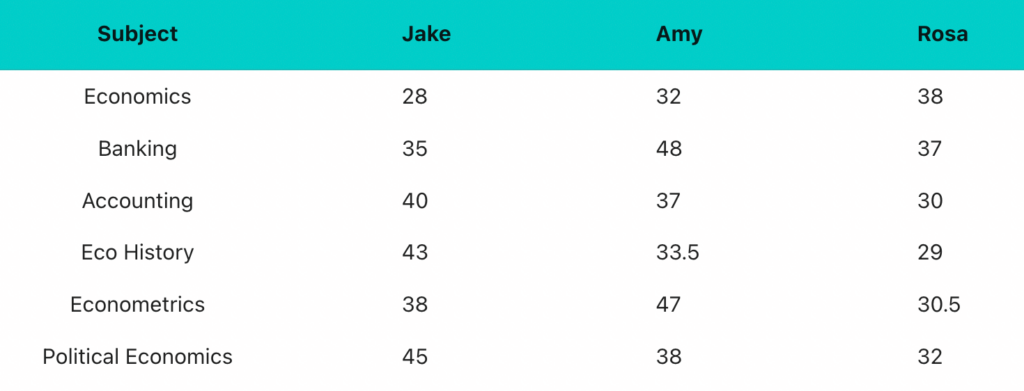
This is the table we’ll be using for data transfer into the chart.
The table title is “For Chart,” and it only has 4 columns, 7 rows (including the header), 6 academic subjects, and marks obtained by 3 students.
Ninja Charts’ features are all easy to use. You can customize the chart as you want, including the chart height, color, font, axis, etc.
Install and activate Ninja Tables on your WordPress dashboard and “Enable” Ninja Charts to auto-install the charts addon.
Or, you can get it from wordpress.org as a standalone tool.
Here’s how you can create an interactive chart in WordPress with Ninja Tables.
Step 1: Select “Add Chart” from the Ninja Tables menu
As soon as you install and activate Ninja Charts, Ninja Tables lets you proceed with chart creation.
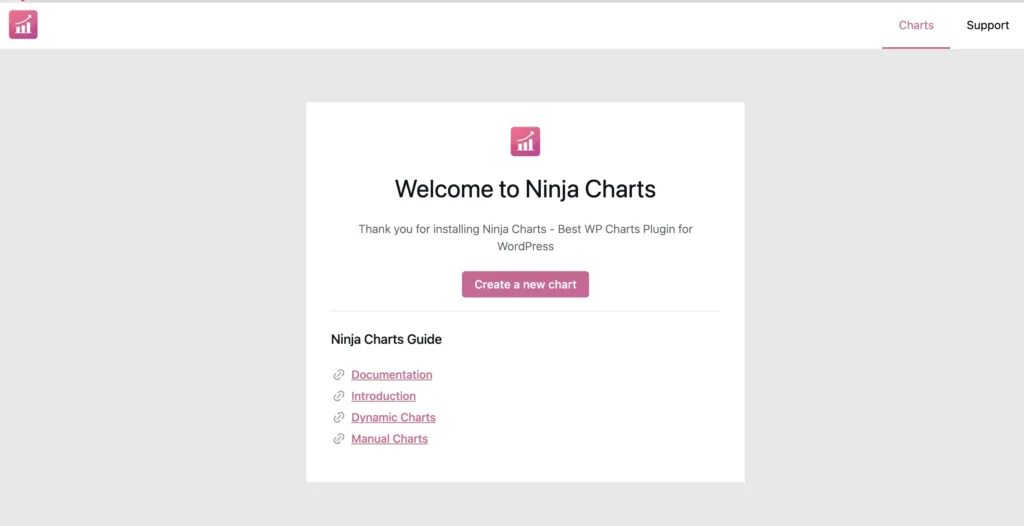
Click “Create a new chart” first from the onboarding window.
Another window will appear with a highlight on “Chart Title & Type”.
From here you can name the chart and pick a chart renderer (Chart Js or Google Charts).
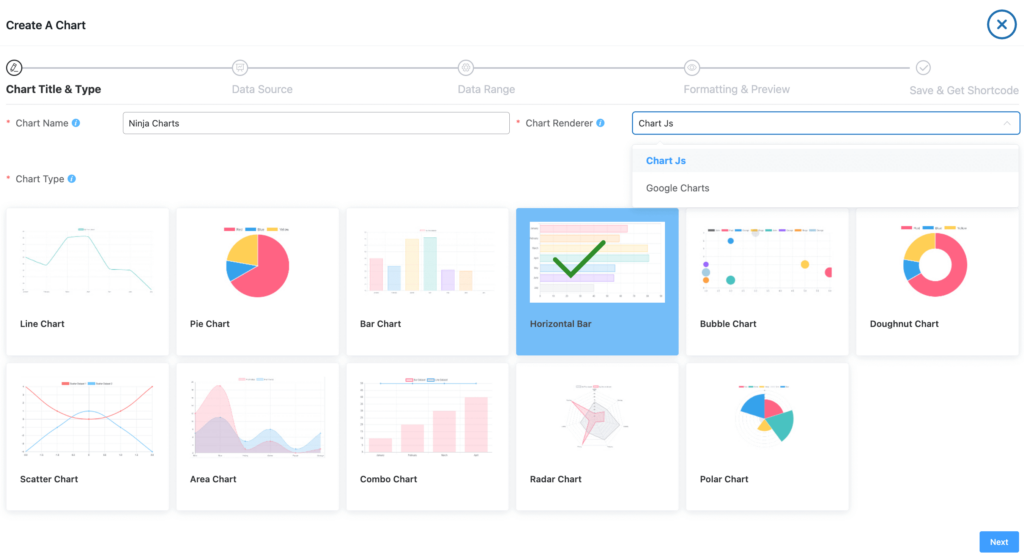
When you select a renderer, multiple chart-type previews will appear.
For example, Chart Js contains the following:
- Line Chart
- Pie Chart
- Bar Chart
- Horizontal Bar
- Bubble Chart
- Doughnut Chart
- Scatter Chart
- Area Chart
- Combo Chart
- Radar Chart
- Polar Chart
Google Charts contain all of the above except Radar and Polar Charts. But it also has “Histogram,” unlike Chart Js.
Since it’s all free, you can pick any style that suits your mood.
We have chosen “Horizontal Bar.”
Step 2: Choose Ninja Tables as the “Data Source”
Moving on to the part where we start to create a chart from Ninja Tables data.
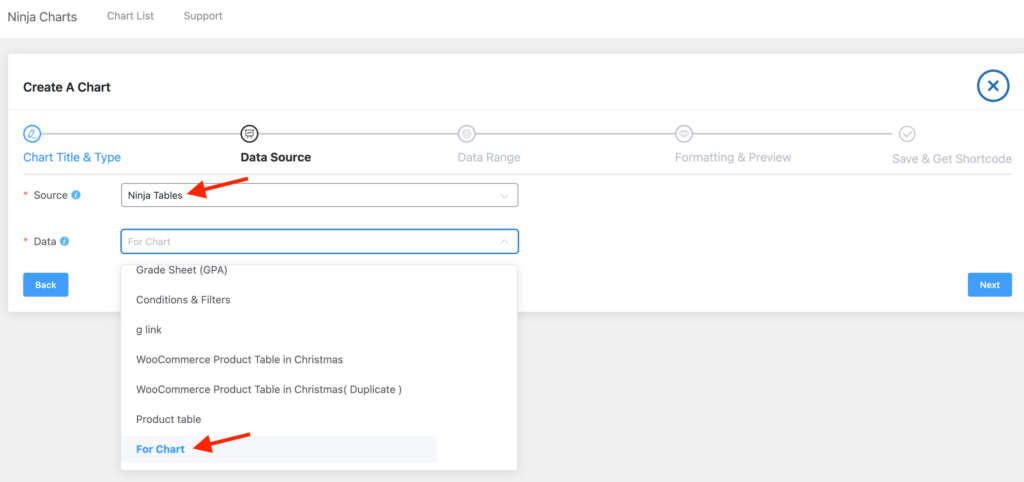
This “Create A Chart” section is where you pick Ninja Tables as “Data Source” and the table data to create the chart from.
We have selected the mock table “For Chart” as data. It was created beforehand.
Note: You can also manually import chart data or fetch data from Fluent Forms.
That’s a story for another day. Check out Ninja Charts documentation for more.
Step 3: Turn table entries into chart
Click “Next” to move to “Data Range” step and pick the table columns you want in your chart.
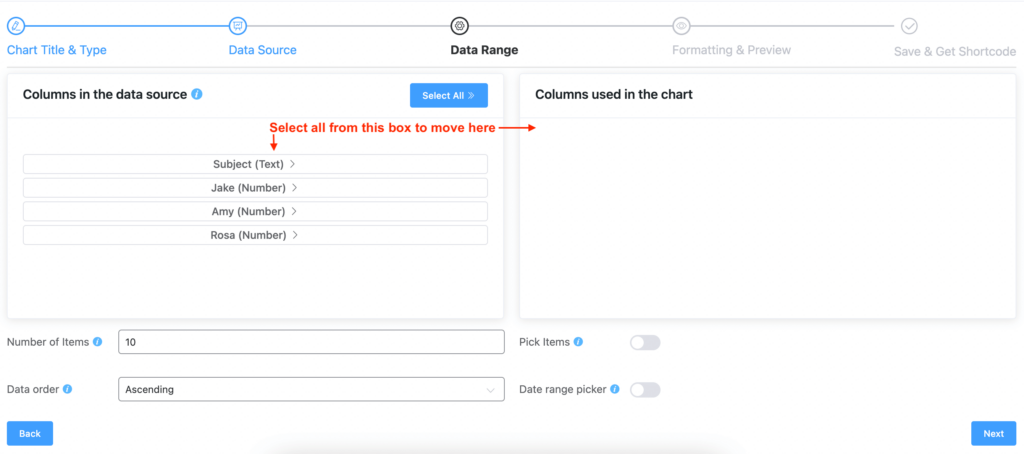
You will be automatically moved to the next window, “Formatting & Preview,” and see the chart is done.
Step 4: Customize the chart
In the “Formatting & Preview” section, you can make changes to the chart in real-time.
8 customizing options will appear on the left with features like coloring, size, fonts, etc.
Chart
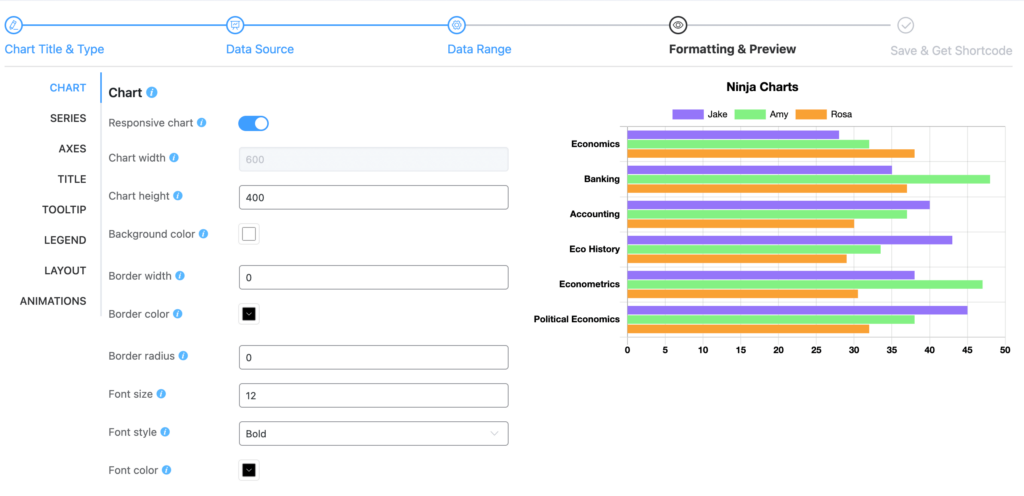
A total of 10 extra editing options come up in this panel.
- Responsive chart
- Chart width
- Chart height
- Background color
- Border width
- Border color
- Border radius
- Font size
- Font style
- Font color
Series
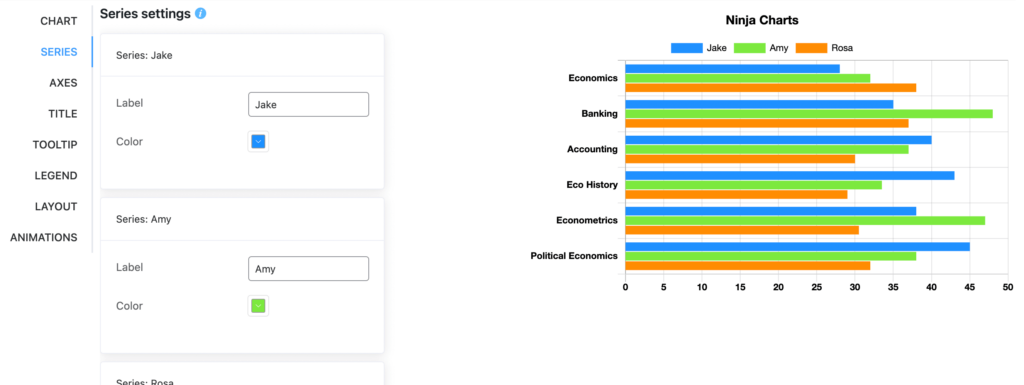
This is where you can redefine series labels and change the colors of the bars.
Axes
6 options are available for this one.
- Show grid
- Show stacked chart
- Horizontal axis label
- Vertical axis label
- Vertical axis min
- Vertical axis max
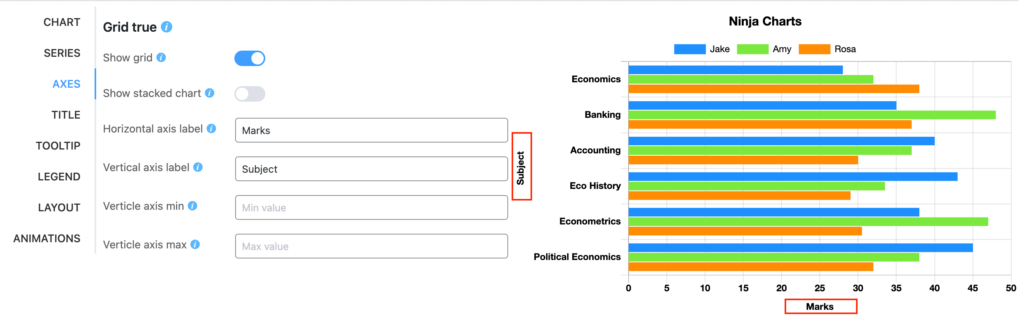
Change the axis labels to fit the data.
If you toggle the “Show grid” button, the grid lines from the background will disappear.
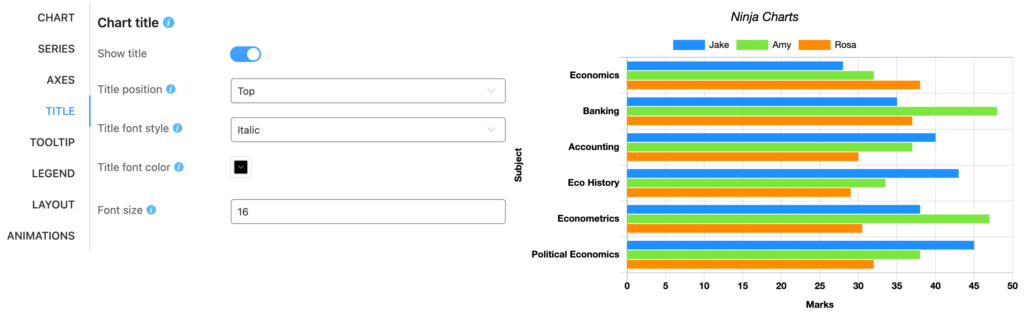
Title
Here you can choose the position of the chart title and more.
- Show title
- Title position
- Title font style
- Title font color
- Font size
Tooltip
You can enable or disable the tooltip feature and change all about it.
- Show tooltip
- Background color
- Border color
- Title font color
- Body font color
- Border width
- Shared tooltip
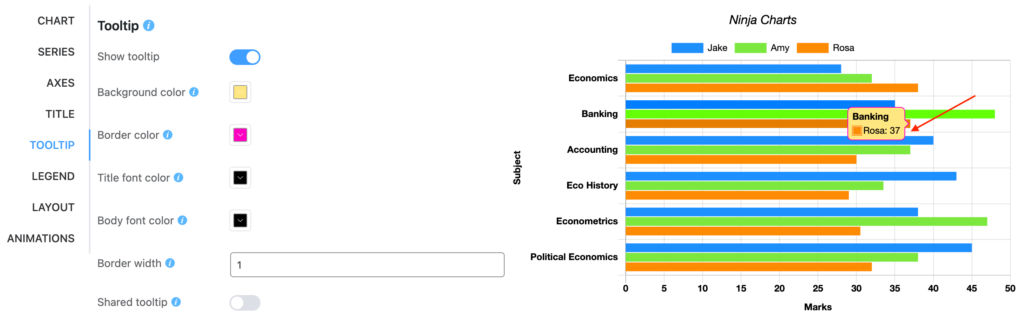
We’ve only customized the tooltip background and border color.
Legend
This one shows what the chart is about, and you can customize its visibility, position, or colors.
- Show legend
- Legend position
- Font color
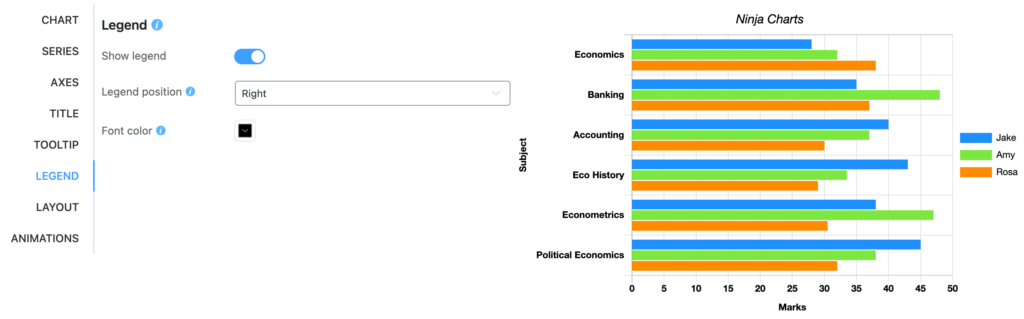
We’ve changed the legend’s default position from top to the right.
Layout
Options here are all for chart padding.
- Padding left
- Padding right
- Padding top
- Padding bottom
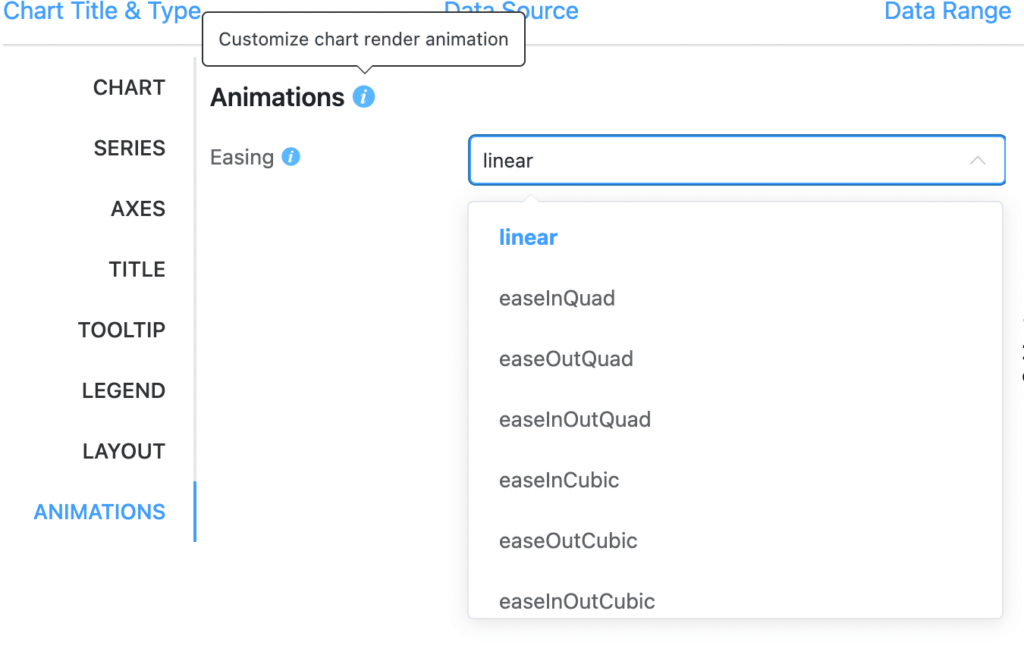
Animations
Customize chart render animation.
Finally, save the changes and copy the chart’s auto-generated shortcode. You can paste this code anywhere.
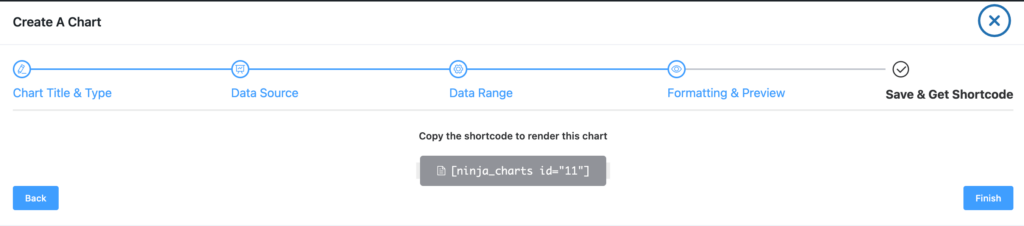
Any further changes in the chart will automatically show up wherever you embed it.
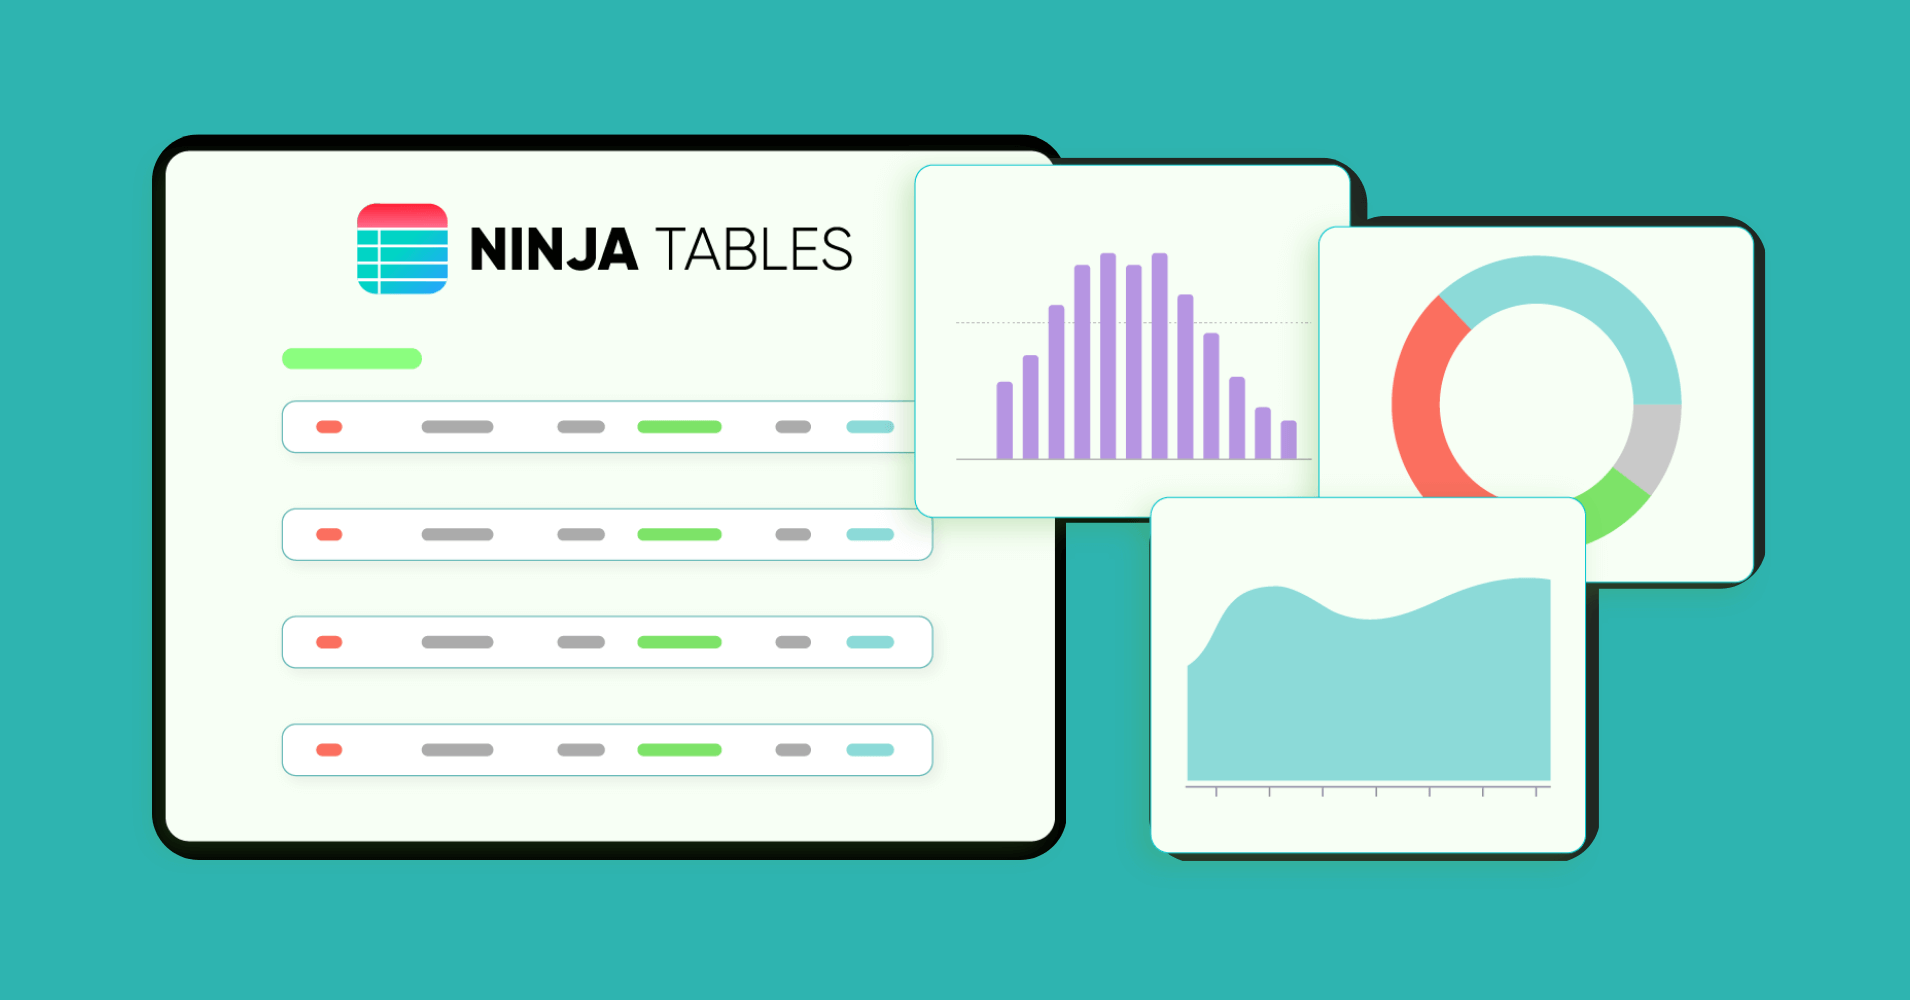
Some charts created using Ninja Charts
Ninja Tables or Ninja Charts, both are the perfect duo for dynamic data visualization in WordPress. Charts are best ways to show trend over time, patterns, and turn raw data into visuals.
Here are some charts by the courtesy of Ninja Charts.
Customer segment contribution
Monthly revenue trend
Email marketing report
Portions
Check out 7 types of comparison charts.
Endnote
When everyone is pumping up their websites with responsive and interactive content, there’s no way we can leave out charts and graphs.
In fact, a well-designed and structured chart is pretty much one of the key things audiences catch on.
WordPress tables are an easy way to increase engagement. As a top WordPress plugin, Ninja Tables’ collaboration with Ninja Charts has fused some awesome powers!
Users can create a chart from a table made in Ninja Tables with just a few clicks. Not to mention manual table creation or using Fluent Forms entries.
Learn about charts and tables for sales data visualization
Convert a table into a chart using this table plugin today and let us know about your experience.
Ninja Tables– Easiest Table Plugin in WordPress


Add your first comment to this post