
Use a Real Estate Listing Table to Get Better Commission

Takeaways:
Focus on the data points and information that actually influence buying decisions. Show detailed property listings in different data tables, like:
- Property listing table
- Property comparison table
- Listing rental property
- Commercial real estate rental listings
- Investment property analysis
- Home inspection checklist
- Market analysis tables
- Open house schedule tables
- Luxury property feature tables
Why do most real estate websites convert worse than a broken vending machine?
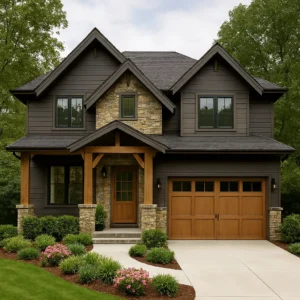
You’ve got a beautiful listed property, spent tons on professional real estate photography, and a detailed description. But somehow, visitors bounce after 30 seconds, and qualified leads slip through your fingers like water. The problem isn’t your inventory – it’s how you’re presenting it.
Traditional real estate websites force visitors to click through individual property pages, trying to juggle dozens of specs, prices, and features mentally. By the time they’ve seen five properties, they’ve forgotten everything about the first three. That’s not a user experience – that’s just torture.
Smart real estate professionals are solving this with a listing of properties in organized, scannable tables that let prospects compare everything at a glance. And on WordPress, Ninja Tables is making this smoother.
Why Tables Demolish Traditional Listing Layouts
Real estate is a comparison business. Whether someone’s looking for their dream home, an investment property, or commercial space, they need to weigh options against each other. Scattered individual listings make this nearly impossible.
Tables change the game completely. Instead of forcing visitors to open 15 browser tabs (and probably crashing their phone in the process), a well-designed property table displays everything side-by-side, better if it’s WordPress templates for real estate with your already installed table plugin. Price, location, square footage, key features – all instantly viewable and comparable.
The result? Visitors spend more time on your site, engage with more properties, and contact you with better-qualified inquiries. Because when people can easily compare options, they make decisions faster. Here’s an ideal example of a real estate template, using which you can really get the best result by creating a structured view for your visitors.
Property Listing | |||
Property Details
|  | ||
Aquisition Details | Financial Information | ||
Purchase Price (PP) | $400,000 | Down Payment (20%) | $80,000 |
Repair Costs | $12,000 | Loan Amount | $320,000 |
Purchasing Cost (% of PP) | $20,000 | Maturity | 30 Years |
Other Costs | $3,000 | Interest Rate | 3.75% |
Total Project Cost | $441,000 | Monthly Principal & Interest | $1,500 |
After Repair Value | $520,000 | Closing Cost | $6,000 |
WordPress Real Estate: Where Most Sites Fall Short
WordPress powers millions of real estate websites, but most agents and agencies are barely scratching the surface of what’s possible. They install a basic property plugin, upload some photos, and wonder why their conversion rates are terrible.
The missing piece? Proper data organization and presentation.
Ninja Tables transforms any WordPress real estate site into a conversion machine. Instead of static property pages that visitors abandon, you get dynamic, interactive tables that encourage exploration and comparison shopping.
Here’s an example of a customized Real Estate list table with Ninja Tables.
| Photo | Name | Neighbourhood Homes | Price | Rooms | Status |
|---|---|---|---|---|---|
 | Suburb Cottage | Valley Rose, Pinewood cottage | $270,000 | 4 | For Sale |
 | Luxury Villa | Beverly home, Calabasas Retreat | 1,555,000 | 7 | Sold |
 | Rustic Home | Suburb cottage, pinewood creek | 200,000 | 3 | Negotiation |
 | Timberstone Haven | Beverly home, George banglow | $575,800 | 4 | For Sale |
Real Estate Table Use Cases that Actually Close Deals
Everyone knows Zillow and Redfin set the bar high for real estate websites. But here’s what most agents miss: you can beat them at their own game with the right approach to property presentation.
The difference between agents who struggle and those who consistently close deals? How they organize and present their listings. Here are some table formats that separate top performers from the rest:
Property listing table
Display your entire home inventory with sortable columns for price, bedrooms, square footage, and neighborhood. Include status indicators (available, under contract, price reduced) and open house schedules. This format works perfectly for showcasing subdivisions or multiple listings in target areas. It’s great for maintaining any realtor property resource management system.
Open House 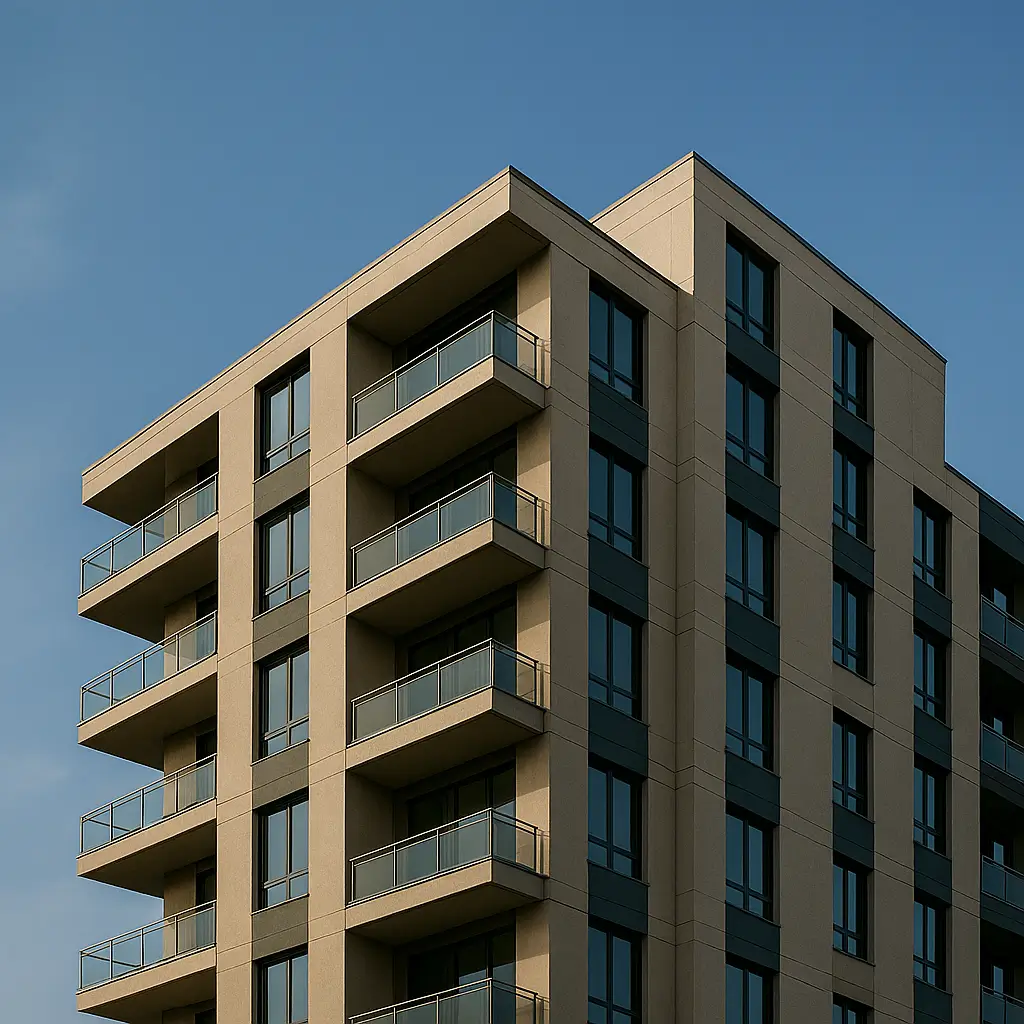 | Closed Listing 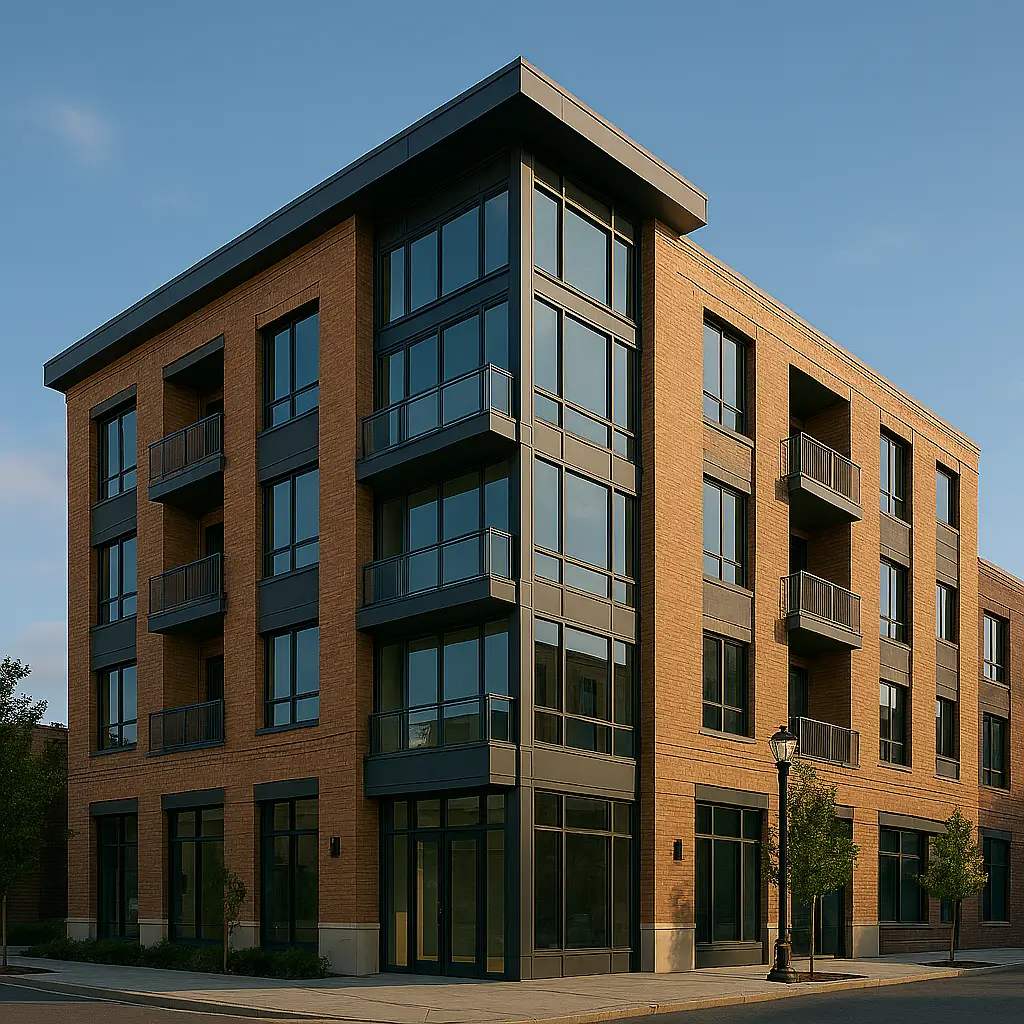 | Price Reduced 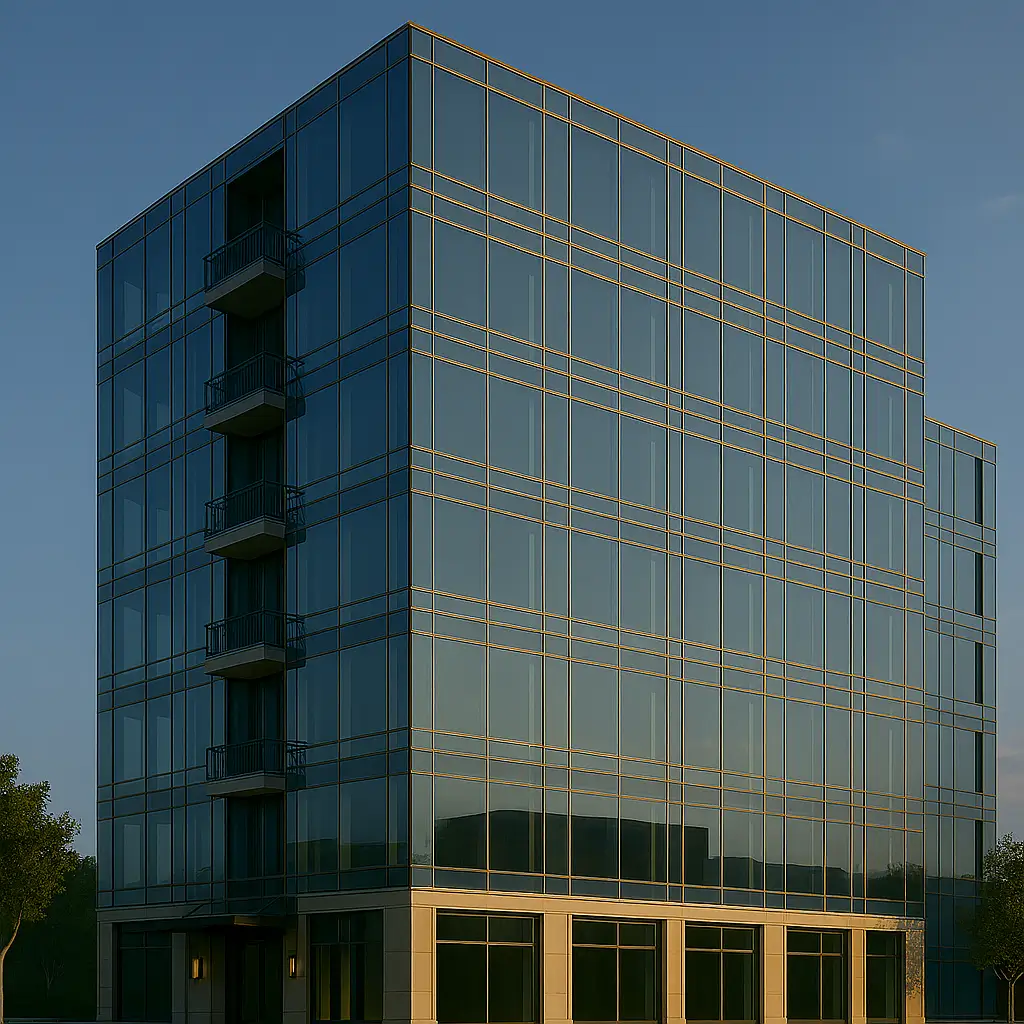 | Open House  |
456 Elm Street | 789 Oak Avenue | 321 Pine Lane | 654 Maple Drive |
Floors 2–4 | Floor 2 | Floor 5 | Floor 2 |
1500 sqft | 1400 sqft | 2000 sqft | 1000 sqft |
2 Bd 2 Bth | 2 Bd 1 Bth | 3 Bd 2 Bth | 1 Bd 1 Bth |
Kara Midley (Agent) | Dave William (Agent) | Kara Midley (Agent) | Sam West (Agent) |
Property comparison table
Good comparison tables reduce cognitive bias in property decisions by presenting clear, side-by-side data. Research shows people struggle with information overload, time pressure, and recency effects when evaluating multiple properties. Well-designed comparison tables solve these problems.
 $2,750,000 22 Pinecrest Avenue |  $2,950,000 310 Willow Creek Rd |  $2,890,000 47 Harbour Blvd | |
Beds & Bath | 4 Bed 4 Bath | 5 Bed 6 Bath | 5 Bed 5 Bath |
Size | 3,000 – 3,400 sqft | 3,800 – 4,200 sqft | 3,500 – 3,900 sqft |
Maintenance Fee | $650.20 | ||
Days on Market | 12 days | 30 days | 8 days |
Tax | $12,480/2026 | $13,950/2025 | $13,120/2025 |
Parking | 2 spots | 4 spots | 3 spots |
Outdoor Space | Terrace, Garden | Pool, Deck, Patio | Balcony, Rooftop Terrace |
Exposure | South | West | East |
Property Type | Detached | Detached Luxury | Condo Penthouse |
Furnished | |||
Estimated Mortgage | |||
|
|
|
|
Neighbourhood | |||
Neighboring Area | Avg Price/sqft | Last Year Growth | Explore |
Forest Hill | $725/sqft | 3.2% up | |
Bayview Glen | $910/sqft | 6.8% up | |
King East | $980/sqft | 5.1% up | |

Key design principles for effective property comparisons
- Limit options to 5 properties maximum to reduce complexity
- Use precise terminology with explanations
- Make differences easily scannable
- Ensure all information is credible and current.
Property comparison attributes should include location factors, building quality indicators, amenity access, neighborhood characteristics, layout details, and comprehensive pricing analysis. This positions you as a consultant providing valuable market intelligence rather than just another salesperson pushing listings.
Read this guide on how to design the perfect feature comparison table in WordPress.
Listing rental property
Organize rental inventory with monthly rent, security deposits, lease terms, and tenant requirements. Include utility information, pet policies, and availability dates. Estate managers can easily show off their full property collections on rental websites with smart filtering options. With each property having its own dedicated agent and a detailed home inspection list, clients can feel confident about safety and quality before making any decisions.
| Name | Contact | Managing Property |
|---|---|---|
| Sarah Mitchell | +1 212-555-4839 | Skyline Tower Penthouse – Unit 1203 |
| David Johnson | +1 646-555-7281 | Green Valley Apartments – Block B |
| Donna Rodriguez | +1 718-555-6042 | Palm Grove Villas – Villa 22 |
| Michael Carter | +1 917-555-8394 | CityOne Corporate Plaza – Suite 401 |
| Jessica Wong | +1 347-555-9512 | Riverbend Warehouse – Lot 9 |
| Daniel Hughes | +1 929-555-3678 | Midtown Business Hub – Office 14 |
| Property Address | Type | Purpose | Bedrooms, Bathrooms | Area Size | Status | Assigned Realtor |
|---|---|---|---|---|---|---|
| Skyline Tower Penthouse – Unit 1203 | Penthouse | Rental | 4, 3 | 4,200 | Closed | Sarah Mitchell |
| Green Valley Apartments – Block B | Apartment | Rental | 2, 1 | 1,100 | Active | David Johnson |
| CityOne Corporate Plaza – Suite 401 | Office Space | Rental | - | 2,800 | Active | Michael Carter |
| Midtown Business Hub – Office 14 | Office Space | Rental | - | 1,900 | Pending | Daniel Hughes |
Property | Inspector Notes | Electrical | Plumbing | Roof/Structure | Interior | Safety Compliance |
Green Valley Apartments – Block B | Well-maintained rental, minor cosmetic updates needed | (roof aging) | ||||
CityOne Corporate Plaza – Suite 401 | Solid structure, HVAC requires servicing | |||||
Skyline Tower Penthouse – Unit 1203 | Luxury finishes, slight water seepage near balcony | Repair pending | ||||
Midtown Business Hub – Office 14 | Modern office, needs fire safety system upgrade | Upgrade required |
Keeping track of client needs can become complicated quickly. Some clients, as parents, might be focused on being close to schools, hospitals, and grocery stores, while grad students may care more about living near the metro, gyms, or late-night shops. If you’re just jotting these details on scraps of paper or simply creating a long list homes for rent, it’s easy to lose sight of what actually matters most to each client.
With Ninja Tables, client management and property management rental listings become effortless. You can set up a clean table that shows each client’s name next to their must-haves. The “select field” feature lets you create a dropdown with common priorities like schools, hospitals, gyms, or transit options—just pick what applies when adding new clients. It functions like a real estate customer management system, but way easier to handle and much smoother to use.
This keeps client info consistent, organized, and easy to scan when you’re matching people with properties.
| Name | Property Size | No of Bedrooms | Nearby Facilities | Must Have | Searching to | Phone No | |
|---|---|---|---|---|---|---|---|
| Jane Houste | less than 1000 | 1 | Metro Station, College, Department Stores | Flexible Entry Hour, Washing Machine, Gym, Balcony | Rent | (123) 456-7890 | [email protected] |
| Nara Smith | 1000-1500 | 2 | Hospital, Metro Station, Department Stores | Gym, Washing Machine, Parking Lot, Security Sytem, Balcony, Trash and recycling | Rent | (234) 567-8901 | [email protected] |
| Alice Johnson | 3500-4000 | 3 | Hospital, Grocery Shop, Park, School, Department Stores | Washing Machine, Pool, Storage Unit, Security Sytem | Purchase | (345) 678-9012 | [email protected] |
| Bob Brown | 2000-3000 | 2 | Park, City Centre, Hospital | Gym, Pool, Parking Lot, Pet-friendly | Lease | (456) 789-0123 | [email protected] |
| Charlie Davis | less than 1000 | 1 | College, Metro Station, Department Stores | Gym, Flexible Entry Hour, Washing Machine | Rent | (567) 890-1234 | [email protected] |
| Emily Wilson | 1000-1500 | 2 | Department Stores, Park, City Centre | Pet-friendly, Balcony, Central Heating System, Trash and recycling | Co-op | (678) 901-2345 | [email protected] |
| Frank Miller | 1000-1500 | 2 | Department Stores, Metro Station, School | Security Sytem, Elevator, Central Heating System | Lease | (789) 012-3456 | [email protected] |
| Grace Lee | 2000-3000 | 2 | City Centre, Hospital, Department Stores, Park | Parking Lot, Washing Machine, Pool, Security Sytem, Balcony, Elevator, Pet-friendly, Central Heating System | Co-op | (012) 345-6789 | [email protected] |
Commercial real estate rental listings
Display office spaces, retail locations, and industrial properties with lease rates, square footage, zoning information, and tenant improvement allowances. Include parking ratios, loading dock details, and proximity to major transportation.
Investment property analysis tables
Include purchase price, estimated renovation costs, show cap rates, cash flow projections, rental closing deal data, and projected returns, etc. Serious investors expect this level of detail upfront.
Property Details | Type | Condo | Financial overview | ||
Days on market | 75 | Monthly expenses | $1,850 | ||
Built (year) | 2010 | Cashflow | $2,500 | ||
Lot size | 15,600 | Cash on cash return | 8.4% | ||
Price per sqft | $280 | Occupancy rate | 90 days | ||
Parking | 2 | Renovation cost | |||
Bedroom | 4 |
|
| ||
Bathroom | 3 | Total | $9600 | ||
Home inspection checklist
Organize inspection findings by category, priority level, and estimated repair costs. This transparency builds trust and helps buyers make informed decisions about offers and negotiations.
Property | Inspector Notes | Electrical | Plumbing | Roof/Structure | Interior | Safety Compliance |
Green Valley Apartments – Block B | Well-maintained rental, minor cosmetic updates needed | (roof aging) | ||||
CityOne Corporate Plaza – Suite 401 | Solid structure, HVAC requires servicing | |||||
Skyline Tower Penthouse – Unit 1203 | Luxury finishes, slight water seepage near balcony | Repair pending | ||||
Midtown Business Hub – Office 14 | Modern office, needs fire safety system upgrade | Upgrade required |
Market analysis tables
Present neighborhood sales data, price trends, and market statistics. Include average days on market, price per square foot comparisons, and seasonal trends. This establishes you as the local market expert.
Open house schedule tables
List all upcoming open houses with dates, times, property highlights, and agent information. Visitors can plan their house-hunting weekends more efficiently, leading to higher attendance. It’s like a traditional ledger or property book, but a modern version that won’t drive you crazy when you need to track down one client’s booking or schedule on a busy Monday morning.
Luxury property feature tables
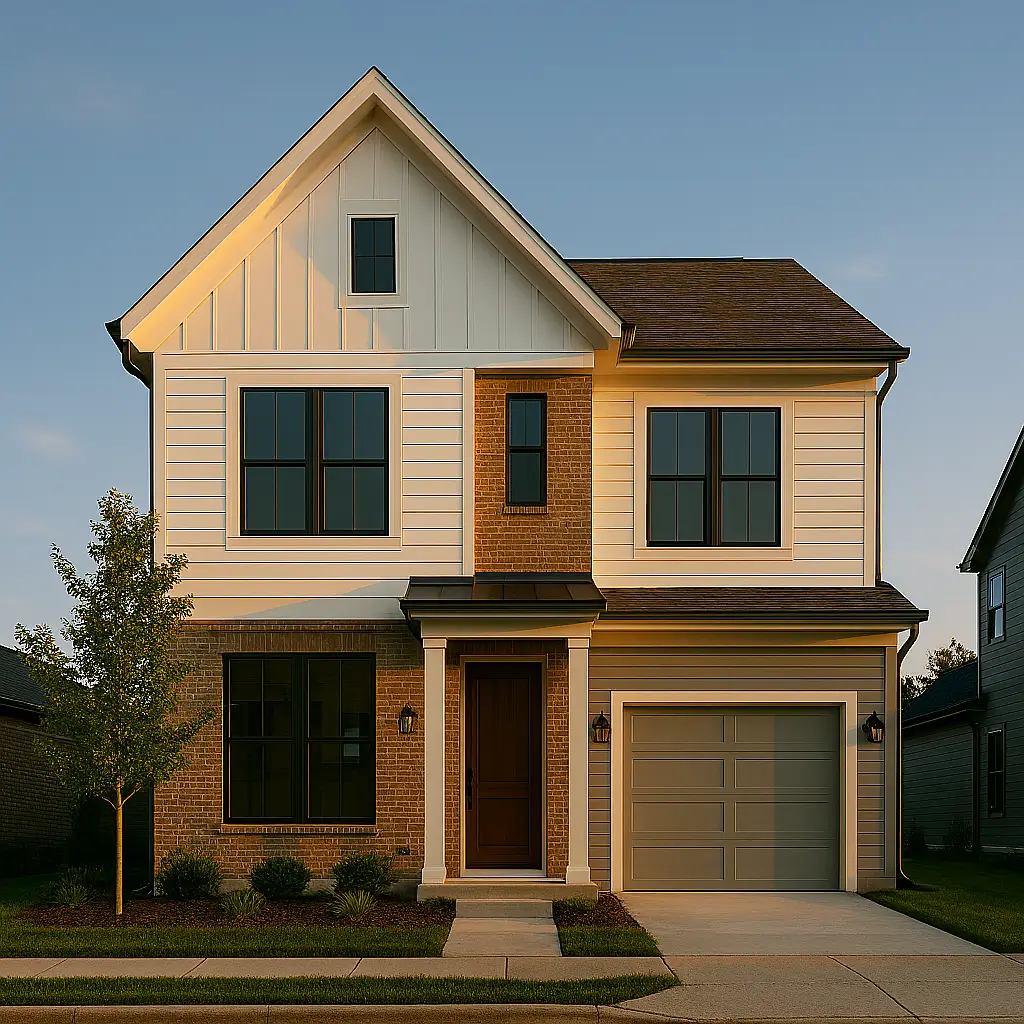
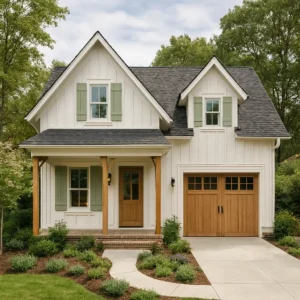
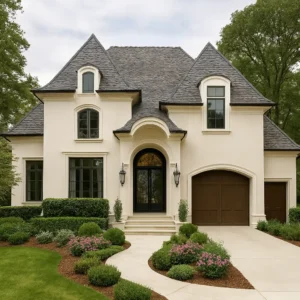
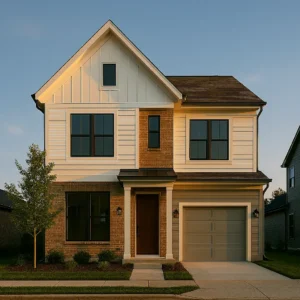
Highlight premium amenities, architectural details, and exclusive features across your high-end inventory, all in one property management table. This real estate asset management table may include lot sizes, view descriptions, and special property characteristics that justify premium pricing. You can add a nice layout with real estate photography images in a gallery table like this-


The Technical Stuff That Actually Matters
Performance matters more than fancy animations. Nobody cares how pretty your site is if it takes 8 seconds to load property data. Ninja Tables handles thousands of rows without breaking a sweat, which is useful than some of those bloated real estate platforms.
Integration Power: Ninja Tables plays nice with other tools. Connect it with Google Sheets data, and integrate with lead capture forms like Fluent Forms. Agents can automate their entire workflow through clever integrations.
SEO Benefits: These WordPress templates for real estate don’t just help you organize everything professionally; they also boost your website’s search engine visibility. How?
Many people worry that adding endless lists and tables might slow down their site. But Ninja Tables is different. Its seamless WordPress integration, lightweight design, and fast sync with unlimited data keep your SEO strong. This gives you a huge advantage for local SEO, helping you show up when people search for ‘newly listed homes for sale near me’, ‘house rental listings near me’, and similar terms.
This smart approach with a simple table plugin lets you work efficiently without installing multiple WordPress real estate plugins that could clutter your website’s backend.
Skip the old-school marketing tactics like chasing people down the road with property brochures. Instead, let clients find you online. This happens when you truly understand what your target customers need.
How Organized Data Presentation Increases Your Commission Rate
A professional presentation directly impacts perceived value and client trust. When your WordPress real estate site displays properties in clean, organized tables, you immediately separate yourself from competitors using outdated listing formats.
Ninja Tables gives real estate professionals the tools to create stunning, functional property displays that keep visitors engaged longer and generate more qualified inquiries. Better organization leads to faster decisions, and faster decisions mean more closed deals.
Why it works
Brochures, PDFs, lengthy descriptions, and unending scrolling are examples of fragmented data that is given shape by organized data. A property table distills important information into a concise, easily readable picture rather than bombarding readers with walls of text. At a glance, price, features, and market positioning are all apparent.
- Streamlined Information Architecture: Prospects don’t need to click through multiple pages. They can filter, sort, and compare instantly.
- Enhanced Professional Credibility: Clear presentation signals expertise and attention to detail, qualities clients naturally trust.
- Improved Lead Quality: When people can self-filter and evaluate upfront, the leads that reach out to you already know what they want. That means fewer dead ends and more serious buyers.
Whether it’s investors evaluating opportunities, families looking for a forever home, or sellers wanting their property to shine, an organized table builds confidence and clarity. Turning raw data into a professional, transparent, and data-driven experience is far more persuasive than photos or marketing copy alone.
Finally
Most real estate websites still present properties like it’s the 2007s peak Myspace page, which added more cons like scattered pages, limited comparison options, and frustrating user experiences. When you implement well-designed property tables, you immediately stand out from the competition.
Visitors spend more time on your site. They engage with more properties. They contact you with better-qualified inquiries. And they remember your site when they’re ready to make decisions.
Because in a business where relationships and trust drive everything, making it easy for people to work with you is the best marketing strategy of all.
Ready to turn your WordPress real estate site into a conversion powerhouse? Your property listing tables are about to become your biggest glow-up!
Ninja Tables– Easiest Table Plugin in WordPress


Add your first comment to this post