
Big Data Tables in WordPress: What Works and What Breaks

Most WordPress table plugins work beautifully until the data gets serious. Five hundred rows feel fine. Five thousand rows or an 80 megabyte file start to lag. Fifty thousand rows can freeze a page entirely, with everything crashing down at the final moment. If your site is dealing with large inventories, financial records, statistics, or product catalogs, that performance block is not a plugin quirk. It is a fundamental architecture problem. In this blog, we will break down why WordPress tables struggle at scale, what actually separates a capable solution from a limited one, and what is coming soon that changes the picture significantly.
TL;DR
- Standard WordPress table plugins load all data into the browser at once, which causes slowdowns with large datasets
- Performance problems at scale are not a styling issue — they are a data processing issue
- Server-side processing solves this by fetching only the data the user is currently viewing
- Rendering engines determine how a table handles data volume, not just how it looks
- Big data table use cases in WordPress range from WooCommerce catalogs to financial dashboards to healthcare records
- Ninja Tables is introducing something special as an alternative rendering engine in an upcoming release, built specifically for massive data volumes
What Is a Big Data Table in WordPress?
A big data table in WordPress is any table that displays a high volume of rows, typically in the thousands or tens of thousands, pulled from a database or external data source. The term covers a wide range of scenarios: product catalogs with thousands of SKUs, employee directories across large organizations, financial transaction logs, real estate listings of all branches across multiple cities, sports statistics archives, and scientific or healthcare datasets.
What separates a big data table from a standard one is not just the number of rows. It is the expectation that users can still search, sort, filter, paginate, and use more of the nitty-gritty interactive and fundamental features through that data without the page slowing down or crashing. A table with 50 rows is simple to render. A table with 50,000 rows that still loads in under two seconds, responds instantly to a search query, and does not overload the user’s browser — that requires a different approach entirely.
Standard Table | Big Data Table |
Handles "Under 1,000 rows" efficiently Standard plugins work fine for smaller datasets. Simple to render with minimal rows A table with 50 rows is simple to render. Basic display capabilities Standard plugins are sufficient for basic needs. | Manages "10,000+ rows" effectively Rendering engine matters for extensive data. Handles "Under 1,000 rows" efficiently Loads quickly and responds instantly with many rows. Supports interactive features easily Users can still search, sort, filter, and paginate through that data without the page slowing down or crashing. |
Courtesy of Ninja Tables
Why Standard WordPress Tables Break at Scale
Most WordPress table plugins operate in what is called client-side processing mode. When a visitor loads the page, the plugin fetches every single row from the database and sends the full dataset to the visitor’s browser. The browser then handles all the sorting, searching, and filtering using JavaScript.
This works well when row counts are low. The browser is fast enough to process a few hundred records without any noticeable delay. But as datasets grow, the browser starts to buckle under the weight of the data it has to hold and process. As a rule of thumb, client-side processing works well for fewer than 10,000 rows, while datasets beyond that require server-side processing. The gray area in between is where most WordPress site owners first notice problems.
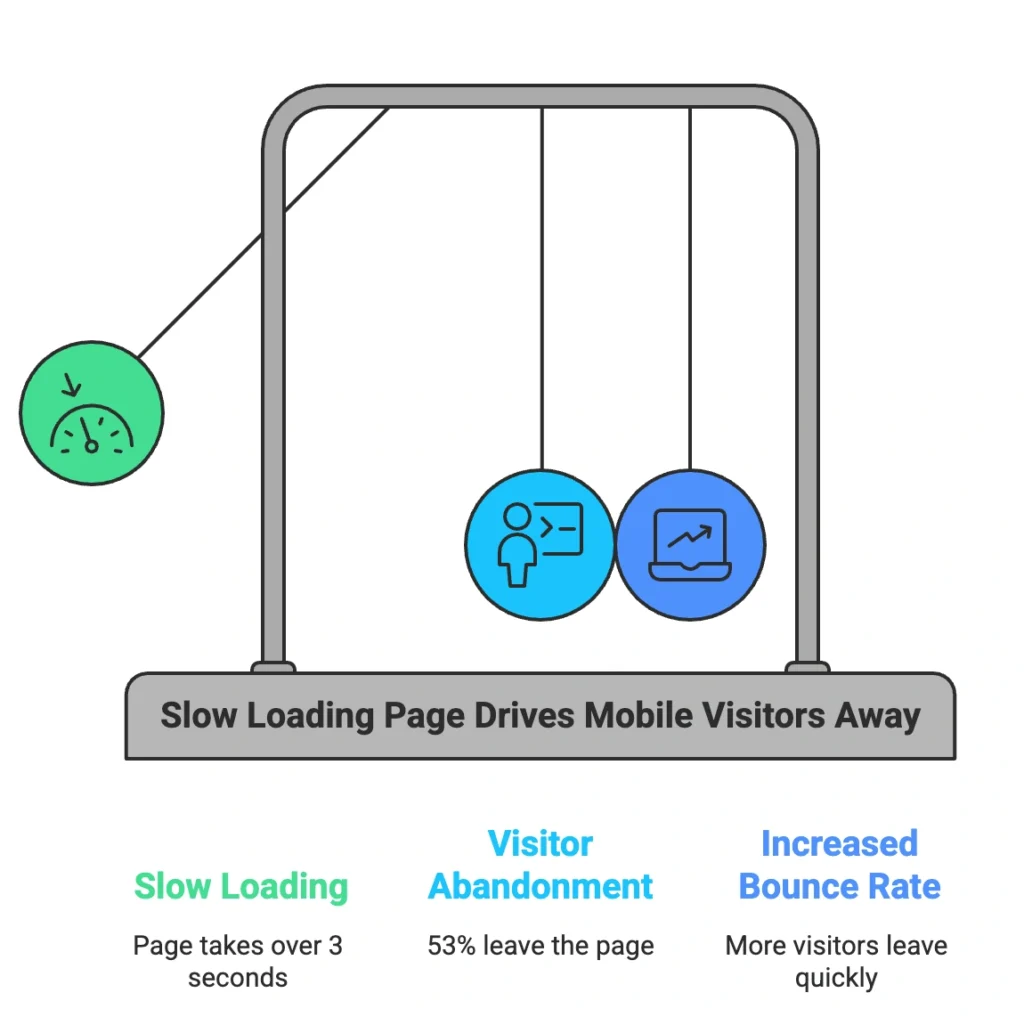
There is also the page load problem that precedes any interaction at all. If a page takes longer than three seconds to load, 53% of mobile visitors will leave. A table plugin sending 20,000 rows to the browser on page load is not going to meet that threshold. By the time the table renders, a significant share of visitors has already left.
The irony is that the data is not actually the problem. WordPress databases can store and query millions of records efficiently. The problem is that standard plugins are designed to move all that data to the browser and let JavaScript handle it, and JavaScript was never built for that job.
What Client-Side vs. Server-Side Processing Actually Means
This distinction matters whether you write code or not, so it is worth understanding clearly.
Client-side processing means: every row goes to the browser, and the browser does all the work. Fast to set up. Breaks under volume.
Server-side processing means: only the rows the user is currently viewing go to the browser. The database handles sorting, filtering, and pagination on the server, where it was designed to do exactly that. When a user clicks to the next page or runs a search, the table sends a request to the server, the server returns only the matching rows for that view, and the browser displays them.
With server-side processing, the big data processing table plugin will make an Ajax request to the server for each draw of the information on the page — when paging, ordering, or searching — sending variables to the server to allow it to perform the required processing and then return only the data required.
For a non-technical site owner: imagine asking a librarian to find a book. Client-side is the librarian handing you every book in the library and telling you to find it yourself. Server-side, is the librarian going to find exactly the book you need and bring just that one back? Same library. Same data. Completely different experience.
Server-side processing mode allows big data table plugins to display data from result sets that may be many millions of records in size, with all ordering, searching, and paging handed off to the server.
Client-Side Processing | Server-Side Processing | |
Fast to set up Quick initial configuration. | Setup Speed | Set up complexity Requires more initial configuration. |
Breaks under volume Performance degrades with large datasets. | Scalability Under Volume | Handles millions of records Efficiently manages very large datasets. |
Browser does all the work All data manipulation occurs in the user's browser. | Data Handling Location | Database handles interactivity Data operations are managed by the server's database. |
User must sift through all data librarian gives the books, you find yourself. | User Experience Analogy | User receives only relevant data Librarian finds exactly the book you need. |
What Makes a Rendering Engine Different From a Table Plugin
Most people think of any WordPress table plugin as a tool for displaying data. That is accurate, but incomplete. What actually determines how a table performs at scale is the rendering engine underneath it.
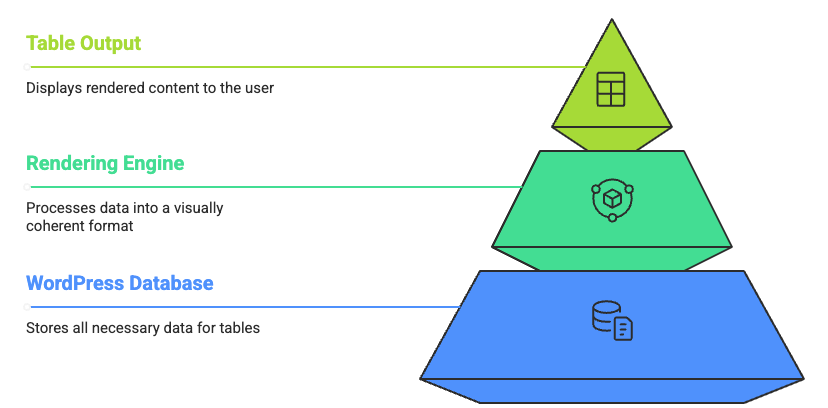
A rendering engine is the core system responsible for how data gets fetched, processed, and drawn onto the screen. Two table plugins can look identical on the surface and behave completely differently with 10,000 rows, because their rendering engines make fundamentally different choices about where data processing happens.
A plugin with a lightweight rendering engine is fine for small datasets. As soon as row counts climb, that engine starts handing work to the browser that the browser is not equipped to handle. A plugin with a more capable rendering engine offloads that work to the server, streams only what is needed, and keeps the table fast regardless of how large the underlying dataset becomes.
This is why “which table plugin looks the best” is the wrong question for high-volume data. The right question is: where does this plugin process data, and what happens to performance when row counts scale up?
If you’re wondering whether your current plugin can handle heavy-duty data, now’s the time to evaluate before committing. As for Ninja Tables — we’re thrilled to say the next version is gearing up to take on any volume of data you throw at it. After the release, go ahead: send all the numbers to its way and let Ninja Tables handle the rest while you sit back and relax!
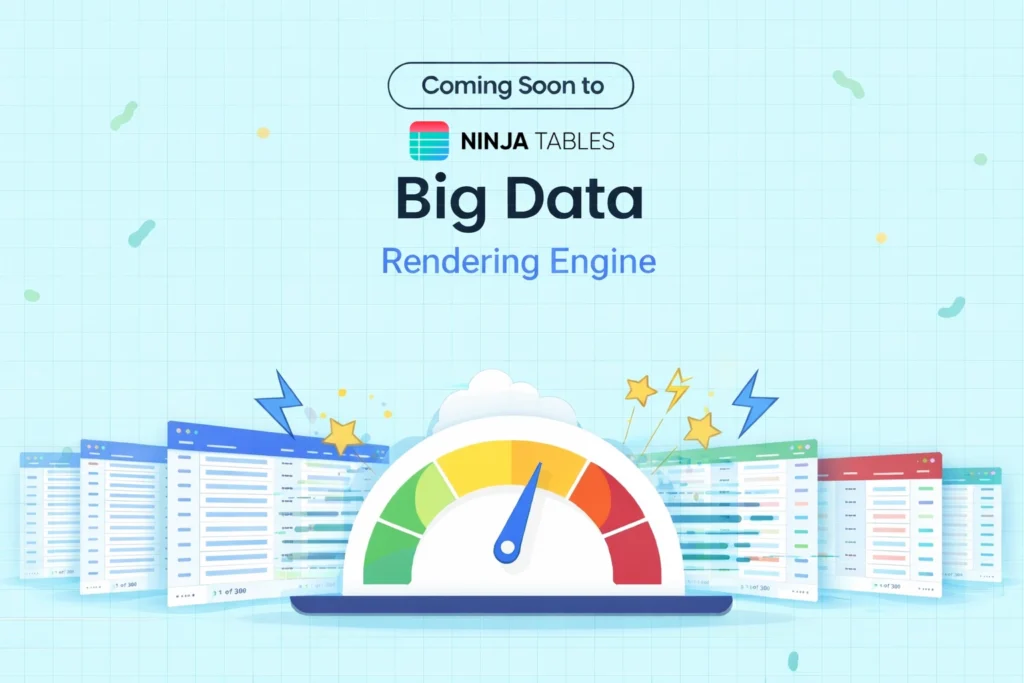
What is Coming to Ninja Tables: A Sneak Peek
Ninja Tables is introducing a feature involving big data as an alternative rendering engine in an upcoming release- dropping very soon.
This is a meaningful transformation. It is one of the most battle-tested data grid libraries available, used across enterprise applications worldwide and capable of handling datasets that run into the millions of rows when paired with server-side processing. Adding it as a rendering engine option inside Ninja Tables means that the same plugin WordPress users already use for creating and managing tables gains access to a significantly more powerful processing layer for high-volume data. With that, all the existing interactive features, tools, and styling options will be capable of supporting your large datasets in table format easily.
More details, including how to configure it and what use cases it supports best, will be available when the release drops. The feature is currently undergoing extensive testing across the team. We’re taking the time to polish and validate everything properly rather than pushing out a rushed, unstable version. The goal is simple: a WordPress-native solution that works smoothly even with large datasets — and that’s exactly what’s coming. Meanwhile, test out our responsive and dynamic version for your every data need.
Real-World Use Cases for Big Data Tables in WordPress
Understanding when you actually need a high-performance rendering solution is as important as understanding how it works. These are the scenarios where the standard plugin approach will eventually let you down:
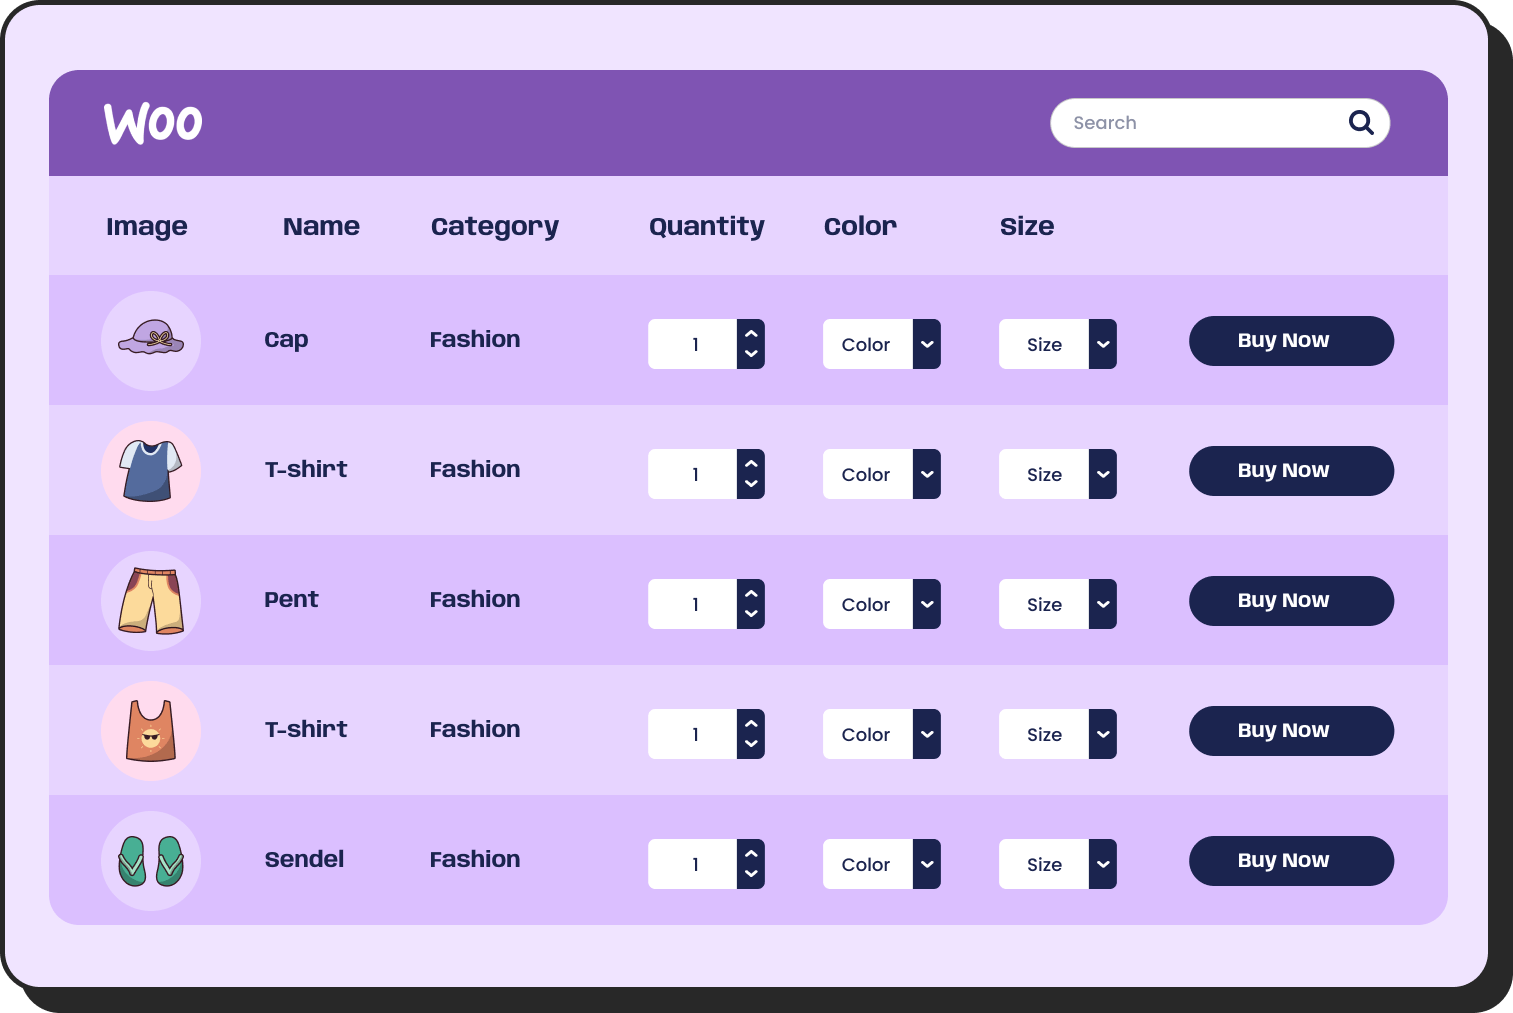
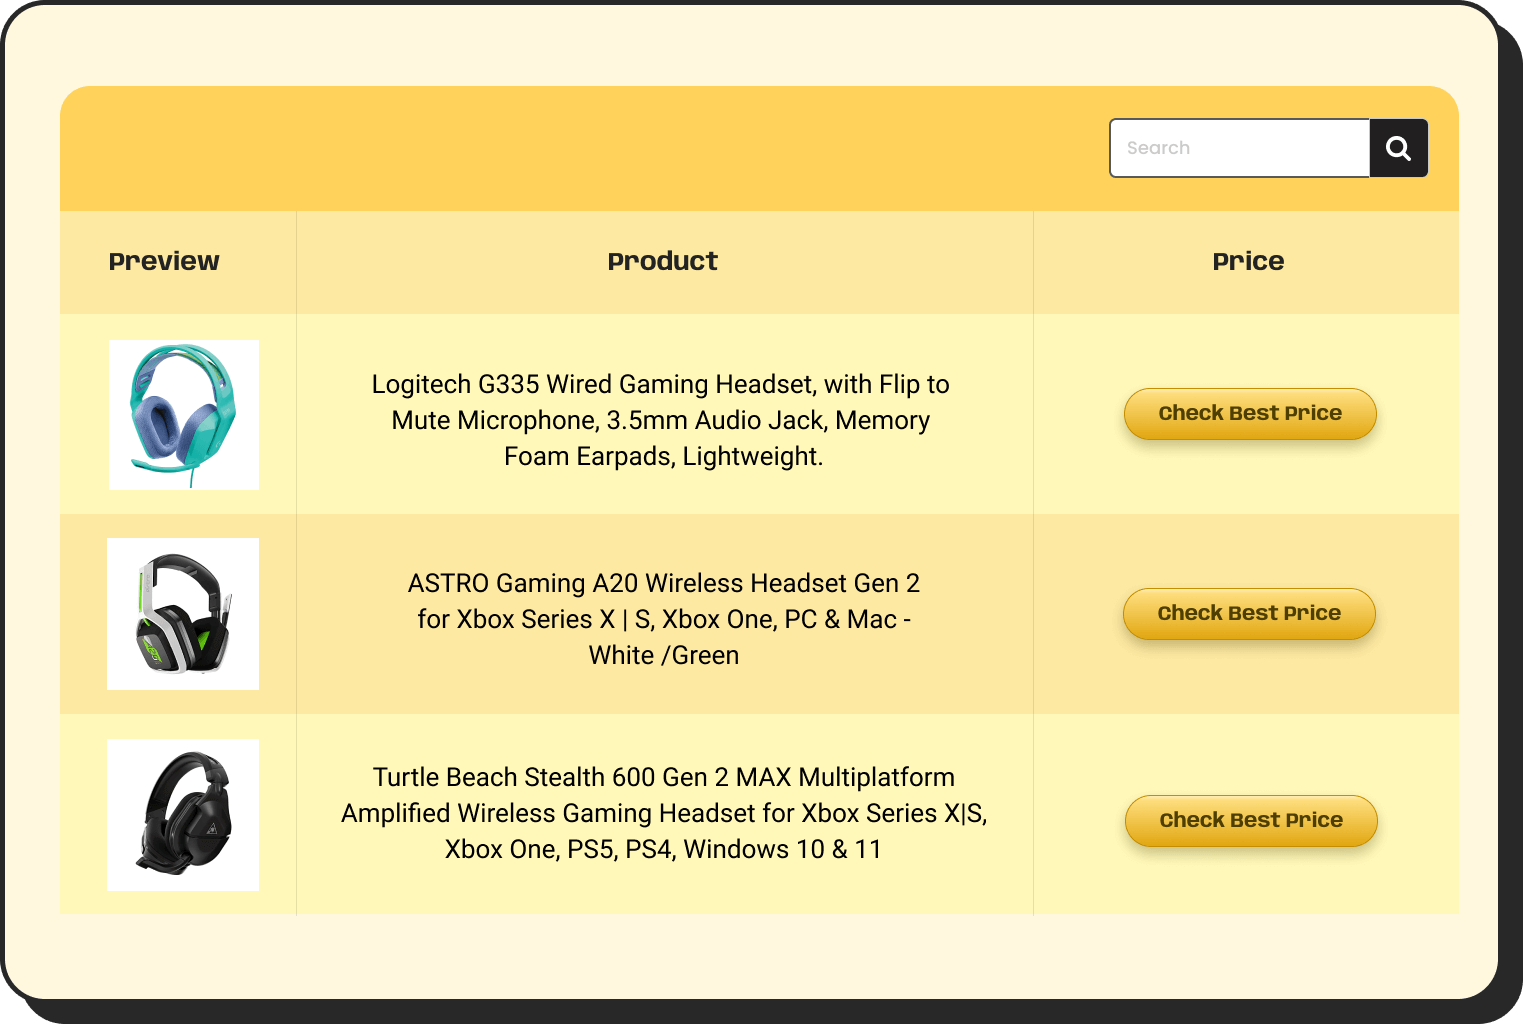
Product catalogs and WooCommerce stores: A store with 5,000 to 50,000 products needs filterable, searchable tables that respond instantly. Client-side processing at that scale creates a poor shopping experience. If you are building enterprise-scale tables in WordPress for an ecommerce operation, rendering engine choice directly affects conversion rates.
| Image | Name | Category | Price | Choose | |
|---|---|---|---|---|---|
 | Blue Hoodie (Zipper) | Hoodies | Original price was: $40.00.$35.00Current price is: $35.00. | | |
 | Hat | Hat | Original price was: $20.00.$15.00Current price is: $15.00. | | |
 | T Shirt | Half sleeve | $45.00 | | |
| T-Shirt with Logo | Tshirts | Original price was: $10.00.$8.00Current price is: $8.00. | | ||
| Beanie with Logo | Accessories | Original price was: $20.00.$18.00Current price is: $18.00. | | ||
 | T-Shirt | Tshirts | $18.00 | | |
 | Long Sleeve Tee | Tshirts | $25.00 | | |
 | Polo | Tshirts | $20.00 | | |
| Hoodie with Logo | Hoodies | $45.00 | | ||
 | Hoodie with Pocket | Hoodies | Original price was: $45.00.$35.00Current price is: $35.00. | | |
 | Hoodie with Zipper | Hoodies | $45.00 | | |
 | Beanie | Accessories | Original price was: $20.00.$18.00Current price is: $18.00. | | |
 | Belt | Accessories | Original price was: $65.00.$55.00Current price is: $55.00. | | |
 | Cap | Accessories | Original price was: $18.00.$16.00Current price is: $16.00. | | |
 | Sunglasses | Accessories | $90.00 | | |
 | Tank Top | Tanktop | Original price was: $45.00.$40.00Current price is: $40.00. | |
Financial and transactional data: Accounting tools, invoice histories, payment logs, and bank statement displays can accumulate hundreds of thousands of rows over time. Users expect to search and filter through years of records without delay.
2026 | 2027 | ||||||
Jan | Feb | Mar | Q2 | Q3 | Q4 | FY | |
Cumulative seats | 0 | 0 | 61 | 594 | 1240 | 2117 | $822 |
End of period | $0 | $0 | $13 | $121 | $464 | $2039 | $850 |
Growth % | 0% | 0% | 282% | 339% | |||
Revenue* | $0 | $9 | $15 | $64 | $133 | $345 | $566 |
Cost of sales* | $1 | $3 | $3 | $31 | $45 | $72 | $15 |
Gross profit* | -$1 | $7 | $11 | $33 | $88 | $273 | $411 |
Gross margin % | 51% | 66% | 79% | 73% | |||
Earning before interest & tax | -$29 | -$29 | -$31 | -$152 | -$195 | -$54 | -$491 |
Financial plan | www.weekly.io | 523-345-7842 | |||||
Sports and analytics dashboards: League statistics, player records, and match histories often span entire seasons or careers. A football club’s player database or a fantasy sports platform can easily hold tens of thousands of records that fans expect to browse interactively.
Healthcare and academic data: Patient records, research datasets, clinical trial results, and academic registries require both performance and precision. A search that takes ten seconds is not just annoying — it creates real workflow problems.
Features | Term Life Insurance | Whole Life Insurance | Universal Life Insurance | Variable Life Insurance |
Cost of policy coverage | Most affordable option | More expensive than term | More expensive than term | Most expensive among all types |
Medical exam required | Varies | |||
Coverage period | Fixed term (10–30 years) | Lifetime | Lifetime | Lifetime |
Premium payment schedule | Can vary | Typically fixed | Fixed | Fixed |
Accumulates cash value | ||||
Flexible death benefit | ||||
Investment component | N/A | Managed by insurer | Managed by insurer | Managed by policy holder |
Eligible for life settlement | Yes, with qualifications | Yes, with qualifications | Yes, with qualifications | Yes, with qualifications |
Withdraw or borrow funds |
Real estate and directory listings: Property databases with thousands of listings, each with multiple filterable attributes, demand server-side processing to stay usable. The same applies to member directories, supplier databases, and job boards.
Open House  | Closed Listing  | Price Reduced  | Open House  |
456 Elm Street | 789 Oak Avenue | 321 Pine Lane | 654 Maple Drive |
Floors 2–4 | Floor 2 | Floor 5 | Floor 2 |
1500 sqft | 1400 sqft | 2000 sqft | 1000 sqft |
2 Bd 2 Bth | 2 Bd 1 Bth | 3 Bd 2 Bth | 1 Bd 1 Bth |
Kara Midley (Agent) | Dave William (Agent) | Kara Midley (Agent) | Sam West (Agent) |
Staff directory table: For organizations spread across different cities, managing employee information can quickly become overwhelming. A staff directory table brings all key details together in a structured, easy-to-navigate format.
| Name | Position | Office | Age | Start date | Salary |
|---|---|---|---|---|---|
| Zorita Serrano | Software Engineer | San Francisco | 56 | 2012/06/01 | $115,000 |
| Zenaida Frank | Software Engineer | New York | 63 | 2010/01/04 | $125,250 |
| Yuri Berry | Chief Marketing Officer (CMO) | New York | 40 | 2009/06/25 | $675,000 |
| Vivian Harrell | Financial Controller | San Francisco | 62 | 2009/02/14 | $452,500 |
| Unity Butler | Marketing Designer | San Francisco | 47 | 2009/12/09 | $85,675 |
| Timothy Mooney | Office Manager | London | 37 | 2008/12/11 | $136,200 |
| Tiger Nixon | System Architect | Edinburgh | 61 | 2011/04/25 | $320,800 |
| Thor Walton | Developer | New York | 61 | 2013/08/11 | $98,540 |
| Tatyana Fitzpatrick | Regional Director | London | 19 | 2010/03/17 | $385,750 |
| Suki Burks | Developer | London | 53 | 2009/10/22 | $114,500 |
| Sonya Frost | Software Engineer | Edinburgh | 23 | 2008/12/13 | $103,600 |
| Shou Itou | Regional Marketing | Tokyo | 20 | 2011/08/14 | $163,000 |
| Shad Decker | Regional Director | Edinburgh | 51 | 2008/11/13 | $183,000 |
| Serge Baldwin | Data Coordinator | Singapore | 64 | 2012/04/09 | $138,575 |
| Sakura Yamamoto | Support Engineer | Tokyo | 37 | 2009/08/19 | $139,575 |
| Rhona Davidson | Integration Specialist | Tokyo | 55 | 2010/10/14 | $327,900 |
| Quinn Flynn | Support Lead | Edinburgh | 22 | 2013/03/03 | $342,000 |
| Prescott Bartlett | Technical Author | London | 27 | 2011/05/07 | $145,000 |
| Paul Byrd | Chief Financial Officer (CFO) | New York | 64 | 2010/06/09 | $725,000 |
| Olivia Liang | Support Engineer | Singapore | 64 | 2011/02/03 | $234,500 |
| Michelle House | Integration Specialist | Sidney | 37 | 2011/06/02 | $95,400 |
| Michael Silva | Marketing Designer | London | 66 | 2012/11/27 | $198,500 |
| Michael Bruce | Javascript Developer | Singapore | 29 | 2011/06/27 | $183,000 |
| Martena Mccray | Post-Sales support | Edinburgh | 46 | 2011/03/09 | $324,050 |
| Lael Greer | Systems Administrator | London | 21 | 2009/02/27 | $103,500 |
| Jonas Alexander | Developer | San Francisco | 30 | 2010/07/14 | $86,500 |
| Jennifer Chang | Regional Director | Singapore | 28 | 2010/11/14 | $357,650 |
| Jennifer Acosta | Junior Javascript Developer | Edinburgh | 43 | 2013/02/01 | $75,650 |
| Jenette Caldwell | Development Lead | New York | 30 | 2011/09/03 | $345,000 |
| Jena Gaines | Office Manager | London | 30 | 2008/12/19 | $90,560 |
We already have an extensive free table template library for you to choose from and use without any hassle.
Get table templates for free
WooCommerce
Amazon Products
WP Posts
Products Comparison
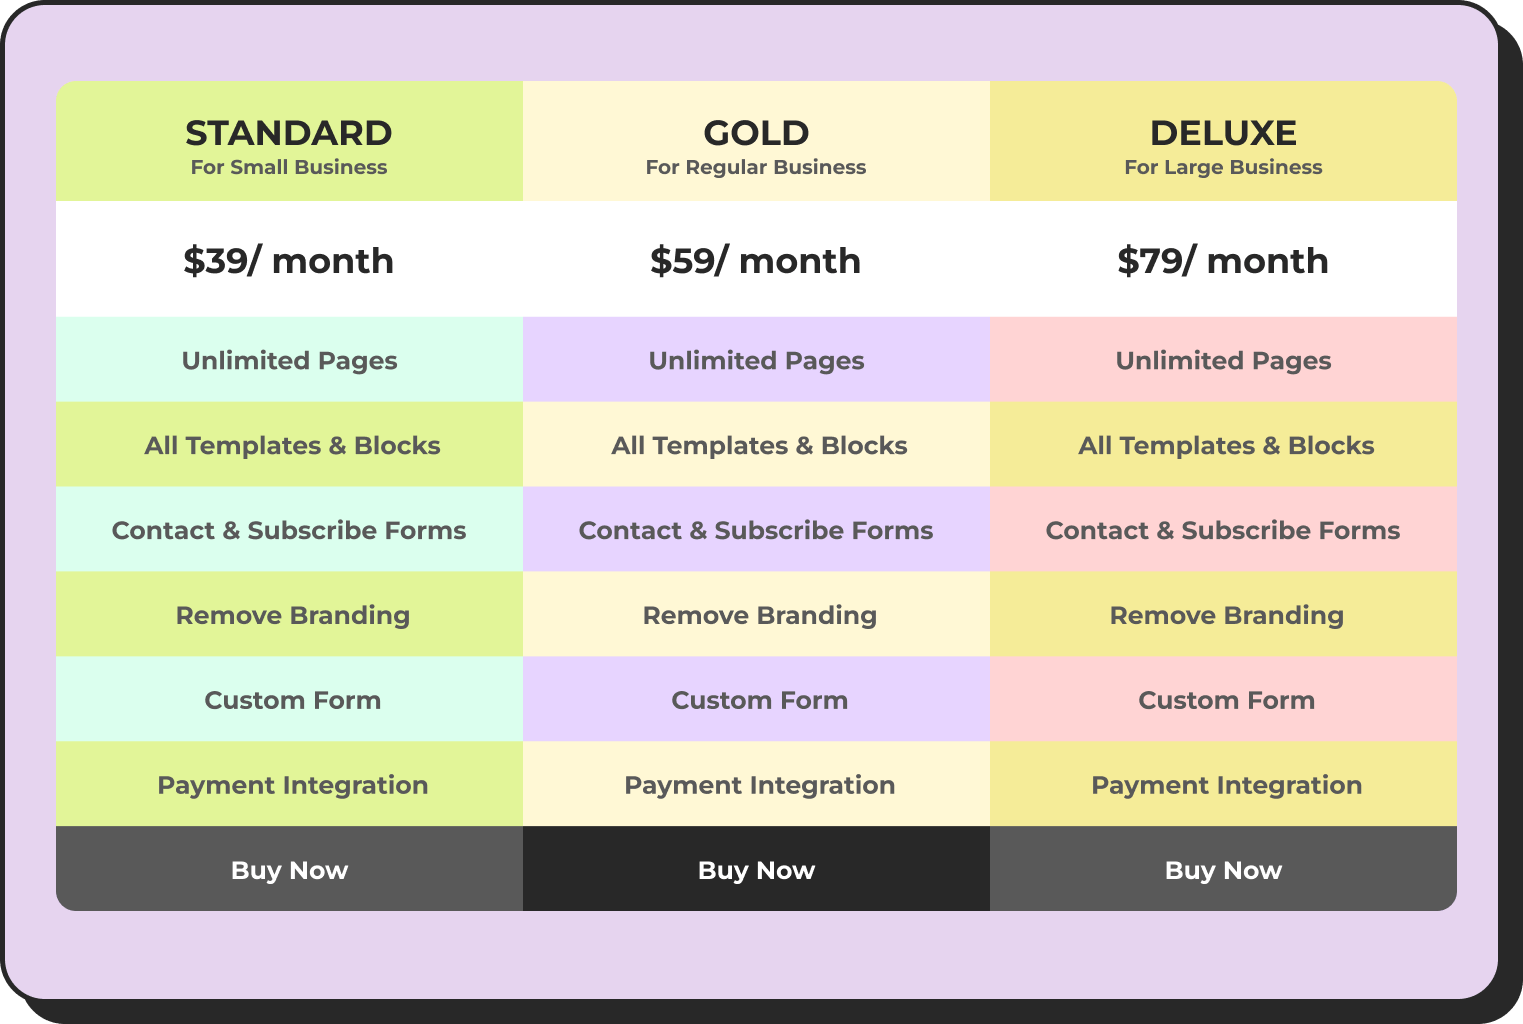
Pricing Table
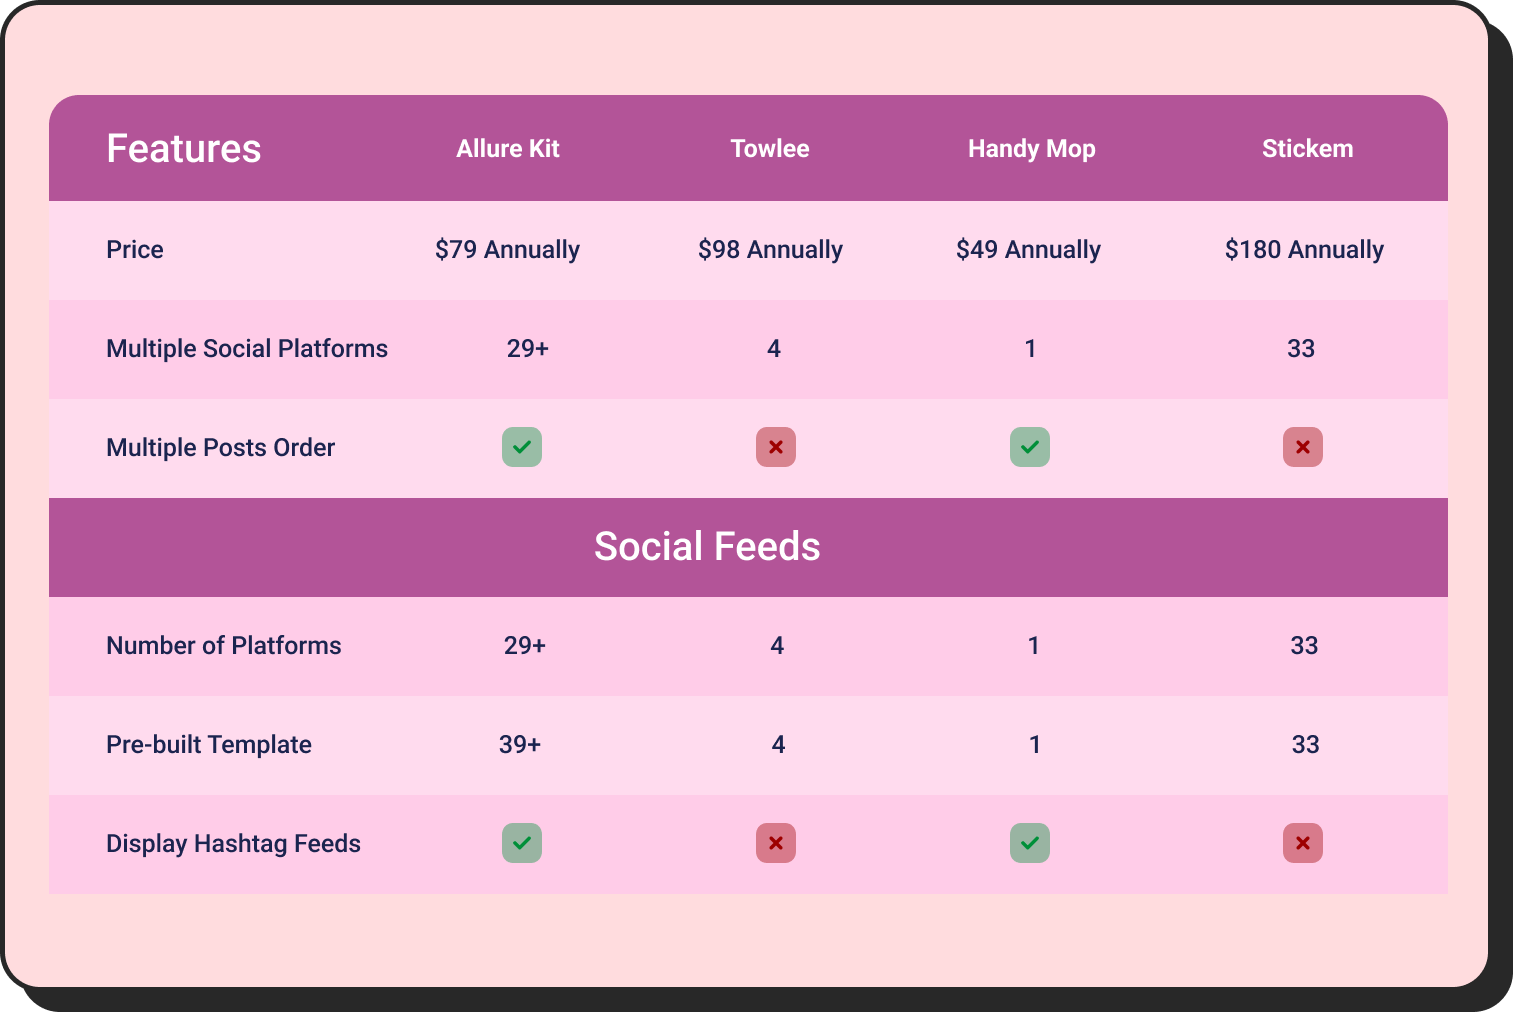
Features Comparison
In every one of these cases, the data visualization layer is only as useful as the performance layer beneath it. A table that is designed beautifully but loads slowly is worse than a simple one that works. With these, you might need to see what makes a table plugin good and how you need to choose one.
Pro tips: What Good Data Table Plugin Actually Does
Before evaluating any solution, it helps to know what “working well” means for a big data table.
A table handling large datasets should meet these criteria:
- Initial page load does not carry the full dataset. The browser receives only the first page of results, not all 50,000 rows.
- Search and filter requests return results in under a second. The server handles the query, not the browser.
- Pagination does not reload the page. Ajax requests fetch the next batch of data without a full page refresh.
- Sorting works across the full dataset, not just the visible rows. A client-side sort on 25 visible rows when there are 10,000 total rows produces misleading results.
- The interface remains responsive throughout. Clicking, scrolling, and filtering should not cause freezes, delays, or visual lag.
This all features a layered architecture that depends almost entirely on which rendering engine sits underneath the table.
For those comparing options, a good starting point is understanding what makes a data table design effective beyond just appearance — because performance and design are not separate considerations at scale. A fast table that is poorly structured is still hard to use.
Frequently Asked Questions
What is the difference between client-side and server-side table processing in WordPress?
Client-side processing loads all data into the visitor’s browser, which then handles sorting, filtering, and searching. This works fine for small tables, but degrades significantly as row counts increase. Server-side processing keeps data on the server and only sends the rows the user is currently viewing. Each interaction — a search, a page turn, a column sort — triggers a request to the server, which returns only the relevant data. The result is a table that stays fast regardless of dataset size.
How many rows can a WordPress table plugin handle before performance degrades?
It depends on the rendering engine. Standard client-side plugins typically start showing lag between 1,000 and 5,000 rows, with significant problems beyond 10,000. Plugins using server-side processing can handle hundreds of thousands — or even millions — of rows, because the database handles all data operations and the browser only ever displays a small subset at a time.
Do I need to understand code to benefit from server-side table processing in WordPress?
No. The technical architecture runs underneath the plugin. For a non-technical WordPress user, the experience is simply a table that works fast regardless of how much data is behind it. The plugin handles the server communication, query management, and data pagination automatically. Configuration is done through plugin settings rather than code.
Will a big data table slow down the rest of my WordPress site?
With server-side processing, no — it should not. Because the table only requests small batches of data at a time, it does not create large database queries on every page load. The impact on overall site performance is minimal. Client-side tables, by contrast, can create significant load on both the server and browser by transferring entire datasets on every visit.
What types of data work best in a server-side WordPress table?
Any dataset that is large, frequently queried, or needs to stay current works well. Product catalogs, inventory records, financial logs, member directories, sports statistics, and healthcare datasets are common applications. If users need to search, filter, or sort through more than a few thousand records, server-side processing is the right architecture.
Wrapping Up
WordPress tables have a performance ceiling, and most sites hit it quietly — a page that feels a little slow, a search that only finds results on the current page, a table that loads later than everything else. These are not random bugs. They are the predictable result of loading more data than a browser was designed to handle.
Server-side processing is the architectural answer. A capable rendering engine is what makes it accessible without needing a custom development project. The two together mean your database does the work it was designed to do, your users see only what they need, and your table stays fast regardless of how much data sits behind it.
Ninja Tables is bringing exactly that capability to WordPress in an upcoming release. Keep an eye out.
Ninja Tables– Easiest Table Plugin in WordPress


Add your first comment to this post