
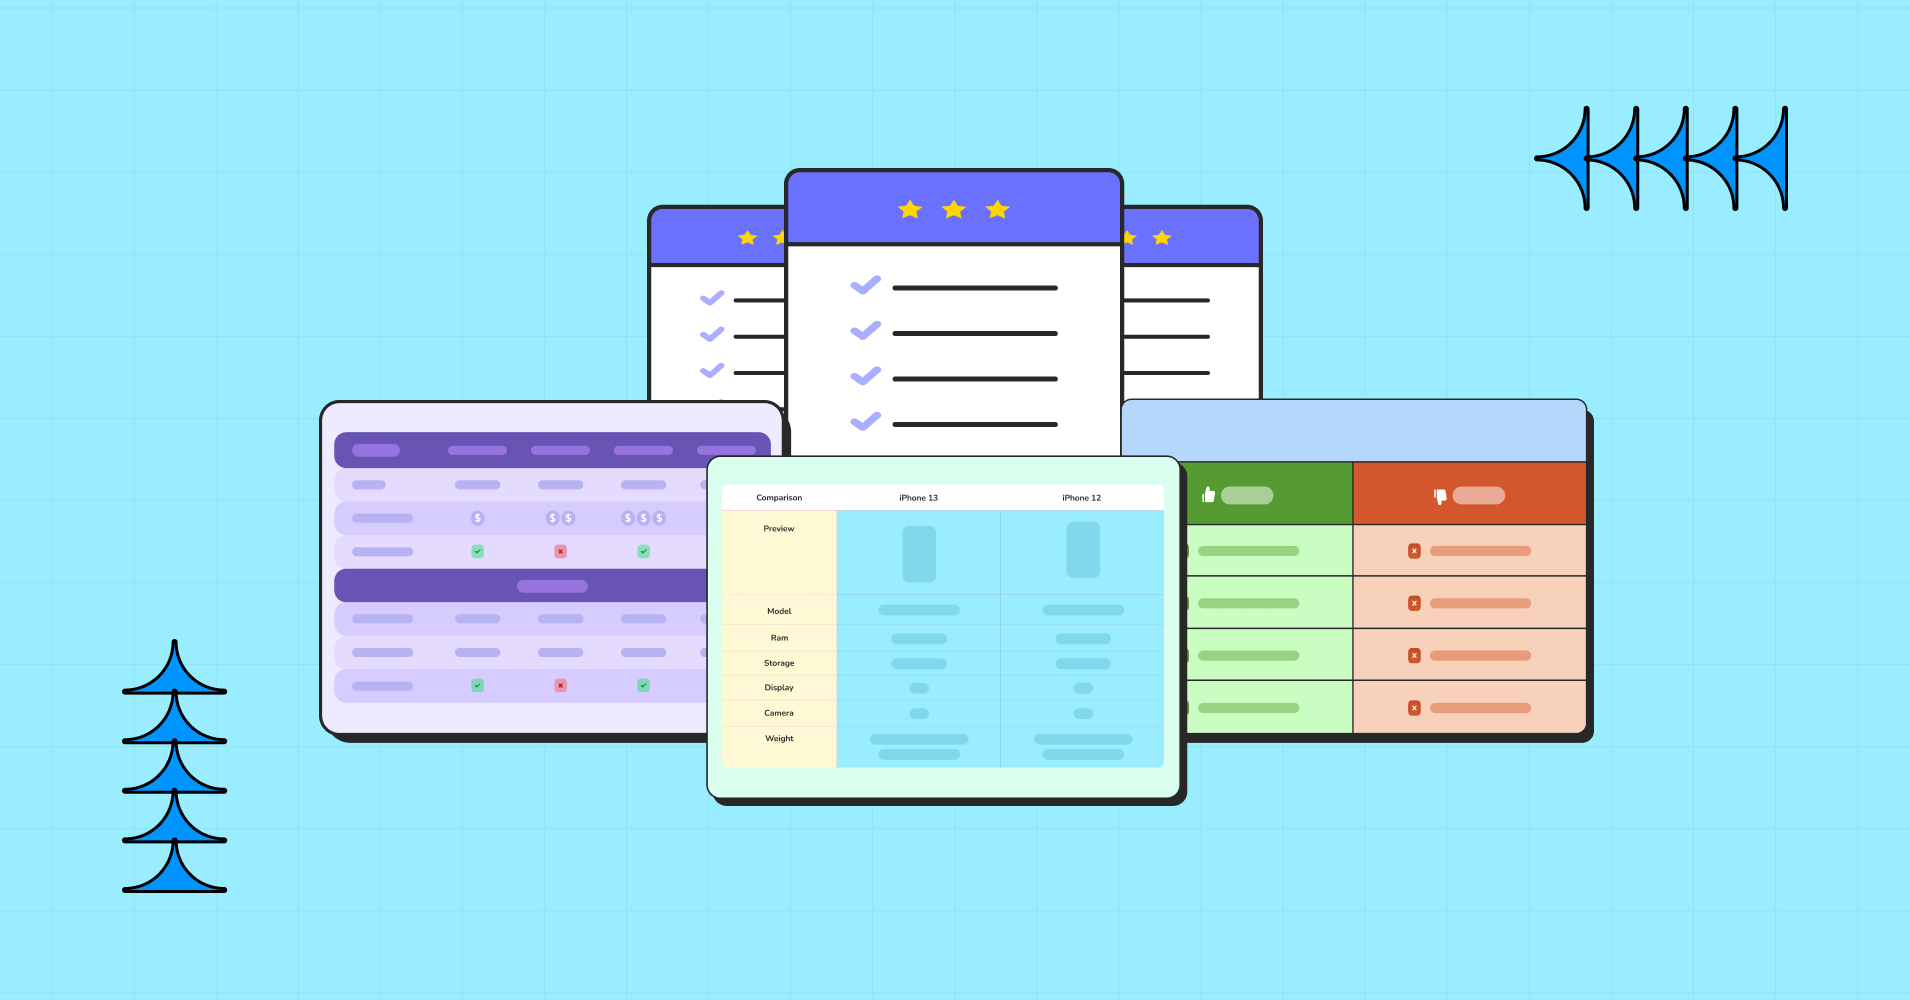
Data Visualization Use Cases and Examples
Does it ever happen to you- you’re seeing numbers after numbers, data thrown at you like bullets, you’re in the middle of the Matrix, overwhelmed by all these? You might feel different if you see those same firing numbers in a more sorted, well-managed layout. Yeah, that’s basically what using Ninja Tables feels like—except it’s your WordPress data, and you’ll dodge the bullets like Neo!
Most table plugins make you feel like you’re assembling IKEA furniture with missing instructions. But Ninja Tables? It’s like you walked into a smart home where every table knows what you need—sortable, searchable, responsive, filterable, API-friendly, easily exported/ transferred from WooCommerce, Google Sheets, or Fluent Forms.
But here’s the twist: it’s not just for devs and data nerds. Ninja Tables is out here quietly powering sleek storefronts, directories, and management workflows—with zero code and all the advanced features.
Let’s dive into some great data visualization examples in real life scenarios where Ninja Tables doesn’t just help—it slays.
Best Data Visualization Examples
When people think of data tables, they often picture boring grids full of numbers and tiny text. But with Ninja Tables, that couldn’t be further from the truth. Think of it as your creative partner in turning plain data into something users enjoy interacting with.
This WordPress table plugin is not a one-size-fits-all tool—it adapts to your data type and the purpose of your content. Whether showcasing products, comparing services, listing out schedules, or presenting complex stats, Ninja Tables gives you the power to make information accessible and engaging. And the best part? Each table can be customized to match your site’s look, branding, and user needs.
So buckle up if you thought tables were for boring spreadsheets and stiff layouts. Let’s explore some of the most popular table types and real-life examples that show how versatile Ninja Tables is.
WooCommerce product tables
Running an online store? With Ninja Tables, WooCommerce products can be displayed in dynamic, sortable, filterable tables that users love. And if you want users to roam around your products without burning too much energy on broken tabs, slow loading speed, breakdown of tables out of nowhere, you might want to consider a WordPress table plugin that holds its fort even in heavy traffic load, instead of crumbling under pressure. Hence, Ninja Tables- responsiveness and compatibility to adapt to any screen size or device type- is your go-to tool.
- Add “Add to Cart” buttons directly inside the table
- Let users filter by category, price, or availability
- Include product images, reviews, and even badges like “Best Seller”
- Customize the table background to match your WooCommerce store aesthetic
Real Use: An organic candle brand can use Ninja Tables to allow customers to sort by scent. Or you can use it to your skin care product store, where you can filter through skin concern, product category, and ratings— all in one place.
| Image | Name | Category | Price | Quantity | Buy |
|---|---|---|---|---|---|
 | Pumpkin Spice (Sweet) | Decor | $20.00 | | |
 | White Tea & Wisteria Scent (Calm) | Decor | $12.00 | | |
 | Magnolia Scent (Fresh) | Decor | Original price was: $15.00.$13.00Current price is: $13.00. | | |
 | Orange-Marigold Scent (Fresh) | Decor | Original price was: $6.00.$4.00Current price is: $4.00. | | |
 | Coffee candle (Sweet) | Decor | Original price was: $10.00.$8.00Current price is: $8.00. | |
Why It Works
Traditional shop layouts can overwhelm users, especially mobile shoppers. Ninja Tables helps by simplifying the experience and letting users control what they see, leading to faster decisions and better UX. It also boosts SEO with structured content display.
Comparison tables that close deals
Showing the difference between similar products, service plans, product features, or reviewing what works best for the users are the real MVPs of all data visualization techniques. Ever seen those neatly packed, informative comparison tables on WordPress sites? That’s Ninja Tables in action.
- Highlight key differences with color-coded rows
- Use checkmarks, icons, and tooltips for clarity
- Mobile-responsive and SEO-friendly
- Provide features or characteristics of the product
- Give clear insight into what each product has to offer
Real Use: A digital marketing agency uses Ninja Tables to compare service tiers, helping visitors quickly understand what they’re getting at each price point. Or following Amazon’s pursuit, any store can sort its customers’ dilemma using side-by-side comparison tables. Here’s a product comparison table example.
Comparison | iPhone 13 | iPhone12 |
Preview |  |  |
Announced | 2022, February 09 | 2021, September 13 |
Status | Available. Released 2022, February 24 | Available. Released 2021, September 25 |
Size | 6.1 inches | 6.1 inches |
Weight | 6.14 ounces | 5.78 ounces |
Processor | A15 | A14 |
Chipset | Apple A15 Bionic (5 nm) | Exynos 2200 (4 nm) - Europe |
Camera | 12 MP, f/1.6, 26mm (wide), 1.7µm, dual pixel PDAF, sensor-shift OIS | 12 MP, f/1.6, 26mm (wide), 1.7µm, dual pixel PDAF, sensor-shift OIS |
Battery | Li-Ion 3240 mAh, non-removable | Li-Ion 3000 mAh, non-removable |
Resolution | 2532x1170 | 2532x1170 |
Pro tip: You can find more product comparison table design in our dedicated table template page.
Why it works
These tables are AJAX-powered, so even massive datasets load smoothly. You can also dynamically update tables from connected Google Sheets—no need to log in and edit each time. Your readers stay informed with real-time info. On the other hand, you can get enhanced performance and more extensive control.
Product review tables show what’s best
Reviews and word of mouth flow further than you think. Instead of running through reviews to see what works best in a product, a summarized review table can help show everything altogether.
- Show overall product review/ratings in the table
- Use the most recent reviews elaborately
- Use functional characteristics with the highest ratings
- Provide links to real customer review posts
- You can combine pros and cons from the customer’s POV
Real Use: This type of review table works best for affiliate programs. Or even influencers can make great use of these review tables to show what worked better for them. Or even as a brand, you can showcase your most hyped product with all the real data, information, and most importantly- reviews of real users.
GSMArena | Product Review I phone 15  The iPhone 15 boasts a Super Retina XDR display, an A16 Bionic chip for powerful performance, and an advanced dual-camera system with a 48MP main sensor for super-high-resolution photos | Jane  Very smooth and fast performance,super camera, but heating | John  Heating issue while charging. It heats up like anything, it will |
AT & T | |||
Trustpilot | Juan  Awesome phone with awesome features. Specifically in love with | Pablo  Overall very good product, specially long lasting battery, | |
Techradar | |||
Pros
| Cons
| ||
Why it works
Core marketing can be done by customers, too! Social proof taps into our instinct to trust relatable experiences. After all, who’s more reliable for honest feedback than real customers? To leverage this, your go-to option is to show different perspectives in a more visually clear and proper way through review tables.
Pros and cons table simplifies decision making
So many products, so many alternatives, one excels the other. How to choose? Why choose yours? A well-built pros and cons table with all the necessary information can answer those for you. If a perfectly structured table layout details in sight, people won’t feel overwhelmed by jumping through multiple tabs, gazing all around to identify which offers what.
- Use ‘tick/cross’ signs to easily pinpoint what each offers
- Use a simple description to convey features
- For multiple products, use categorized cells to distinguish each other
- Use collapsible sections for deeper explanations
- A sticky “Recommended for” row summarizes the ideal user type for each option
Real Use: A niche affiliate site focused on helping small business owners choose the right tools, especially hosting platforms. To drive affiliate clicks and improve time-on-page, Ninja Tables can create a clean, visually compelling Pros and Cons Table comparing top hosting services like Bluehost and Hostinger.
 | |
PROS | CONS |
Affordable pricing plan | No free trial |
No Ad interruption | Buffering/low video quality |
Lots of content choices | Regional content limitation |
Original tv shows and movies | Delayed release |
Varied audio/subtitle options | Unsatisfactory dubbing |
Multiple platform choice | Account Sharing Challenges |
Why It’s Powerful:
It’s psychology 101—people love contrast. When information to make decisions is laid out clearly, it reduces friction. With Ninja Tables, your pros and cons list doesn’t just inform, it converts.
Pricing tables that look good and sell better
A great pricing table is often the final nudge users need before clicking “Buy.” Ninja Tables lets you build sleek, responsive pricing tables that do more than just look pretty.
- Add pricing tiers, benefits, CTA buttons, and badges
- Emphasize the most popular plan visually
- Include monthly/annual toggle options with conditional columns
Real Use: A WordPress plugin developer uses Ninja Tables to show free vs pro features across three pricing tiers, with bold CTAs and trust badges.
PRO | Top! PLUS | BUSINESS |
4.99$/month with 4 days free trail | 9.99$/month with 4 days free trail | 19.99$/month with 4 days free trail |
1 GB Disk Space | 1 GB Disk Space | 1 GB Disk Space |
500 MB Bandwidth | 2 GB Bandwidth | 5 GB Bandwidth |
1 Sub Domain | 3 Sub Domain | 10 Sub Domain |
1 Email Account | 5 Email Account | 10 Email Account |
SMTP | SMTP | SMTP |
Monthly Traffic: 1000 GB | Monthly Traffic: 2000 GB | Monthly Traffic: 3000 GB |
Network Port: 50 Mbps | Network Port: 75 Mbps | Network Port: 100 Mbps |
Why it works
Most users skim. Ninja Tables lets you build tables that guide the eye to the best choice. Whether you’re selling a product or a membership, your pricing table becomes your closer. It’s the key to higher conversion rates.
Data-heavy content without the eyestrain
If your website involves research, reports, or any form of data journalism, traditional layouts just won’t cut it. Ninja Tables lets you present large data sets in scrollable, searchable tables that don’t fry your visitors’ brains.
- Import data from Google Sheets or CSVs in seconds
- Enable pagination and live search
- Make columns sortable with a single click
- Use visual cues, icons for easier readability
Real Use: This education-focused blog displays government exam results, which are downloadable by year, state, and subject, all powered by Ninja Tables.


Why it works
You will find it helpful when maintaining numbers for financial data visualization. This helps to find the data, identify patterns, and trends easily through most of the advanced features like filter, sort, conditional formatting, and highlight features for both shareholders and users. The sword cuts in both ways. It’s also easy on the eye and mind, but holds the powerful control of the message behind those scattered numbers.
Employee directories or listings with a style
Need to list out your entire team, department, or contributors? Don’t resort to plain lists.
- Add profile pictures, job titles, contact details, and links
- Create accordion rows for more details per person
- Let users filter by department, location, or expertise
Real Use: A corporate intranet site can use Ninja Tables to manage a 200+ employee directory with filterable fields like department and designation. Also, to create your brand site, you can easily optimize this type of data table plugin to showcase brand identity, behind-the-scenes heroes.
| Name | Position | Office | Age | Start date | Salary |
|---|---|---|---|---|---|
| Zorita Serrano | Software Engineer | San Francisco | 56 | 2012/06/01 | $115,000 |
| Zenaida Frank | Software Engineer | New York | 63 | 2010/01/04 | $125,250 |
| Yuri Berry | Chief Marketing Officer (CMO) | New York | 40 | 2009/06/25 | $675,000 |
| Vivian Harrell | Financial Controller | San Francisco | 62 | 2009/02/14 | $452,500 |
| Unity Butler | Marketing Designer | San Francisco | 47 | 2009/12/09 | $85,675 |
| Timothy Mooney | Office Manager | London | 37 | 2008/12/11 | $136,200 |
| Tiger Nixon | System Architect | Edinburgh | 61 | 2011/04/25 | $320,800 |
| Thor Walton | Developer | New York | 61 | 2013/08/11 | $98,540 |
| Tatyana Fitzpatrick | Regional Director | London | 19 | 2010/03/17 | $385,750 |
| Suki Burks | Developer | London | 53 | 2009/10/22 | $114,500 |
| Sonya Frost | Software Engineer | Edinburgh | 23 | 2008/12/13 | $103,600 |
| Shou Itou | Regional Marketing | Tokyo | 20 | 2011/08/14 | $163,000 |
| Shad Decker | Regional Director | Edinburgh | 51 | 2008/11/13 | $183,000 |
| Serge Baldwin | Data Coordinator | Singapore | 64 | 2012/04/09 | $138,575 |
| Sakura Yamamoto | Support Engineer | Tokyo | 37 | 2009/08/19 | $139,575 |
| Rhona Davidson | Integration Specialist | Tokyo | 55 | 2010/10/14 | $327,900 |
| Quinn Flynn | Support Lead | Edinburgh | 22 | 2013/03/03 | $342,000 |
| Prescott Bartlett | Technical Author | London | 27 | 2011/05/07 | $145,000 |
| Paul Byrd | Chief Financial Officer (CFO) | New York | 64 | 2010/06/09 | $725,000 |
| Olivia Liang | Support Engineer | Singapore | 64 | 2011/02/03 | $234,500 |
| Michelle House | Integration Specialist | Sidney | 37 | 2011/06/02 | $95,400 |
| Michael Silva | Marketing Designer | London | 66 | 2012/11/27 | $198,500 |
| Michael Bruce | Javascript Developer | Singapore | 29 | 2011/06/27 | $183,000 |
| Martena Mccray | Post-Sales support | Edinburgh | 46 | 2011/03/09 | $324,050 |
| Lael Greer | Systems Administrator | London | 21 | 2009/02/27 | $103,500 |
| Jonas Alexander | Developer | San Francisco | 30 | 2010/07/14 | $86,500 |
| Jennifer Chang | Regional Director | Singapore | 28 | 2010/11/14 | $357,650 |
| Jennifer Acosta | Junior Javascript Developer | Edinburgh | 43 | 2013/02/01 | $75,650 |
| Jenette Caldwell | Development Lead | New York | 30 | 2011/09/03 | $345,000 |
| Jena Gaines | Office Manager | London | 30 | 2008/12/19 | $90,560 |
Why it works
The way the information flows through the organized table and creates an information bank is iconic. All the contact details, positions, name, and official details can be very helpful when maintaining a company website or even for internal workflow. It’s the most consistent way to organize a pyramid of activities.
Multimedia tables make content come alive
To showcase multiple product images, videos, and links in a more organized and structured format use of a multimedia table is an understatement to say the least.
- Display products, their features, or basic images
- Allow hyperlinking those images, thumbnails
- Display images with lightbox mode to create a 3D effect
- Create media-rich portfolios, reviews, tutorials, or product demos
Real Use: A stock gallery type of images to show your photography skills, or your curated vintage stamps, bags, or anything you like to collect. Whether you’re managing product showcases, tutorial collections, course libraries, or media galleries, this is a major UX win.


Why It Delivers:
Instead of clicking through multiple pages or blog posts, users get all the visuals and content they need in one beautifully organized space.
Bonus: Mixed Data Tables? No Problem.
Got a combo of images, ratings, buttons, rich text, and numbers? Ninja Tables handles mixed content with custom column types—so you can combine user avatars, star ratings, call-to-actions, and links in one clean layout.
These tables are responsive, meaning your videos and images scale perfectly across mobile and tablet views. No broken layouts, no bulky plugins. Just stunning, scrollable, content-packed tables.
Also, if you’re now worried about data visualization through charts and tables together; don’t worry, Ninja Charts will help you through the heavy work. This quick read on good data visualization breaks it down for you-layer by layer.
Final Thoughts
These examples barely scratch the surface. From minimal layouts to full-blown interactive dashboards, Ninja Tables makes your data not only readable but irresistible. Ninja Tables is the behind-the-scenes genius that makes websites smarter, faster, and more user-friendly. Whether you’re showcasing products, comparing services, or managing data, it adapts to your story seamlessly.
The best part? You don’t need to touch a single line of code. Just drag, drop, and dominate. You can customize each column, row, color, and button to match your brand style and use case.
Want a personalized suggestion on how your site can use Ninja Tables to stand out? Drop your niche below—We’ll whip up a use case especially for you. Also, feel free to share how you use Ninja Tables for your purpose and give us a glimpse into your world!
Ninja Tables– Easiest Table Plugin in WordPress


Add your first comment to this post