
Ninja Charts 3.5.0: All-New Chart Builder, Dark Mode & More!

Hello, welcome back to another Ninja Charts update!
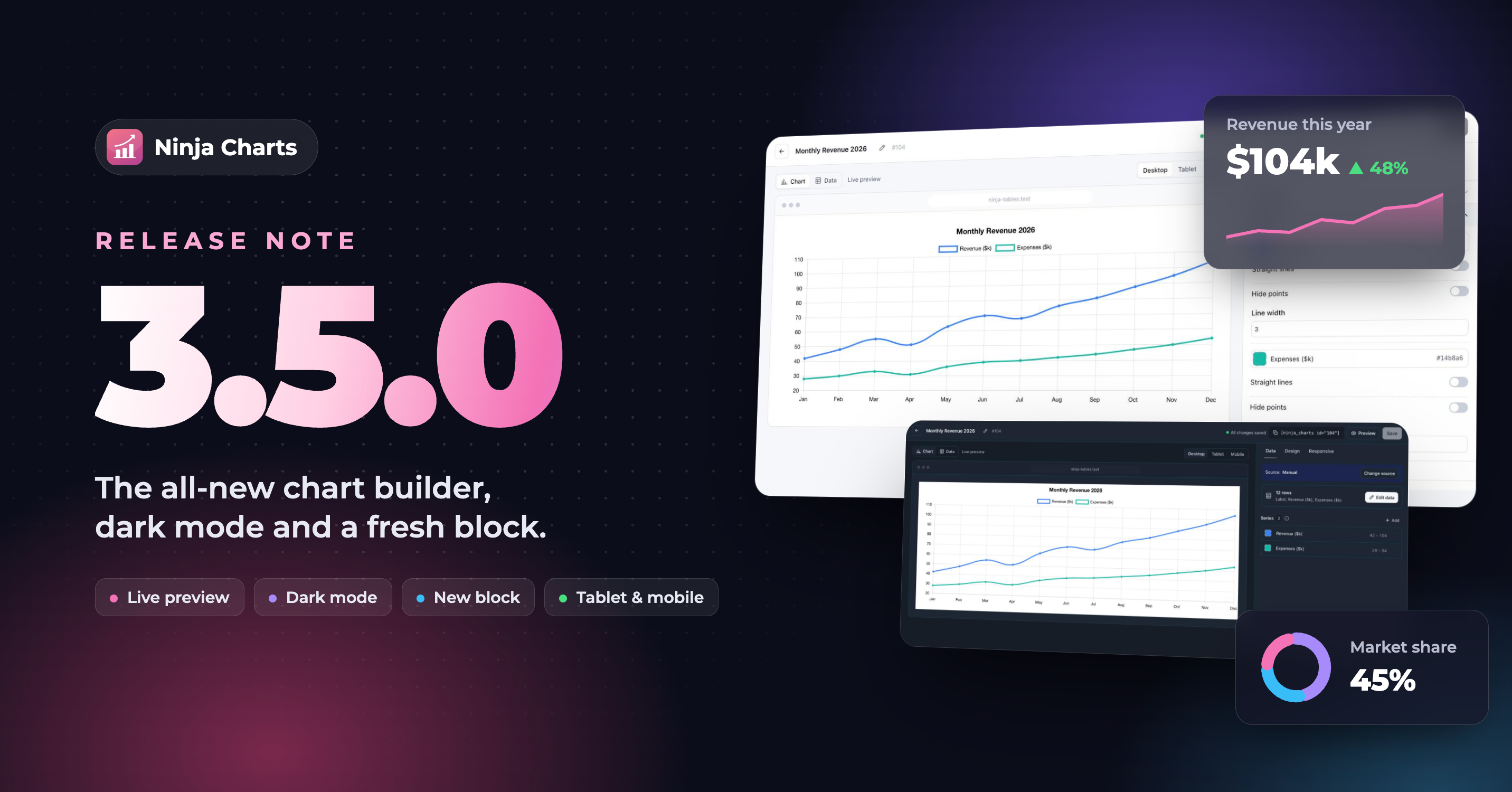
This is our biggest release yet. We rebuilt the whole Ninja Charts admin, so making a chart is faster, clearer and a lot more fun. The Gutenberg block got a fresh new look too, and we fixed a few things that were getting in your way.
But most importantly — the brand-new live chart builder!
Don’t worry about your existing charts. Every chart and shortcode you’ve already made keeps working exactly as before.
What’s New in Ninja Charts 3.5.0?
A live chart builder
The old step-by-step wizard is gone. Now you build your chart on one screen and see it change as you work. Pick a chart type, choose your data and style it, and the preview updates right away. No more guessing, no more going back and forth.
Choosing data is simpler too. Tell Ninja Charts what you want to show, in plain words, and it helps you pick the right data from your source. Each data source also tells you which columns a chart needs, so you know what to set up before you start.
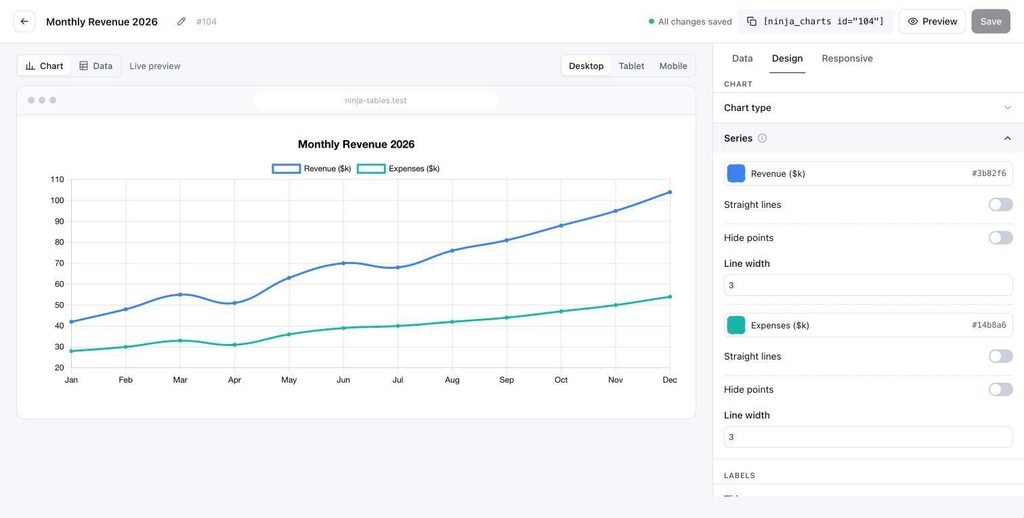
The live chart builder: chart settings on one side, live preview on the other
Light and dark themes
Ninja Charts now has a light theme, a dark theme, and a System option that follows your computer’s setting. It uses the same design as Ninja Tables, so the two plugins look and feel like one family. If you pick dark mode in one, it carries over to the other.
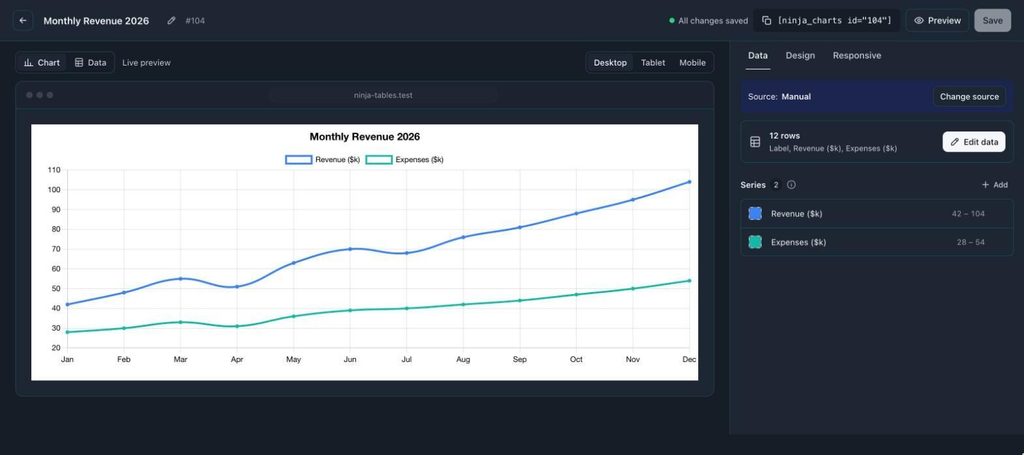
The chart builder in dark mode
A redesigned Gutenberg block
The Ninja Charts block now uses the same clean design as the admin. When you add the block, a new start screen greets you with a chart type picker, so you can get going in a couple of clicks.
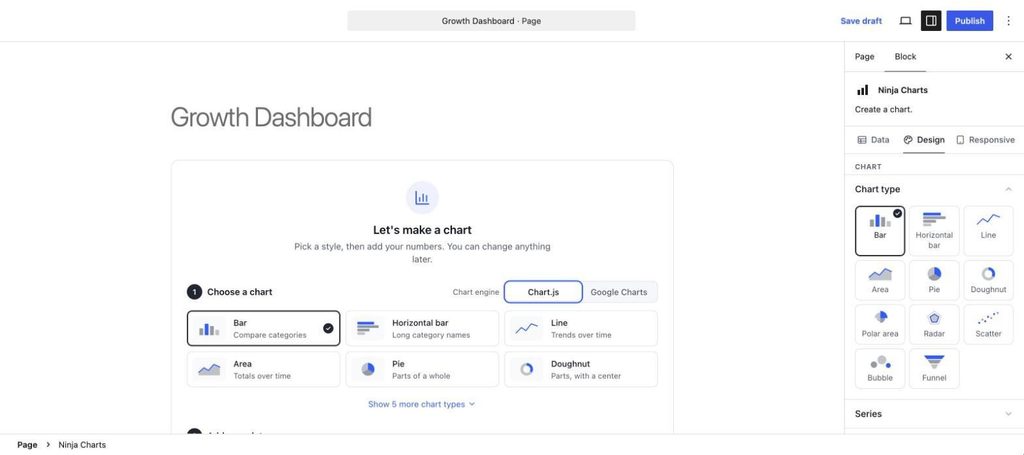
The new Ninja Charts block start screen with the chart type picker in the block editor
New features added
1. Hover settings
You now decide what happens when visitors hover over your chart. For Chart.js charts, choose Highlight, None, or Custom with your own hover colour, and set the hover border width and colour. For Google Charts, you can turn hover effects off, and your tooltips still show.
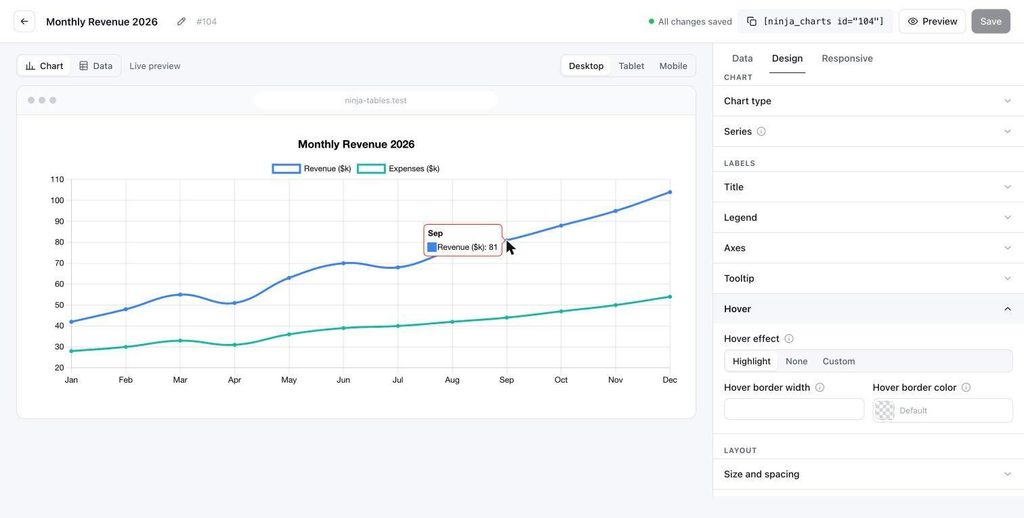
The Hover section in the Design tab with the Highlight, None and Custom options
2. Settings for tablet and mobile
Your chart doesn’t have to look the same on every screen. Set a different height, font size, title and legend for tablet and mobile, then switch between the desktop, tablet and mobile preview frames to see how it looks.
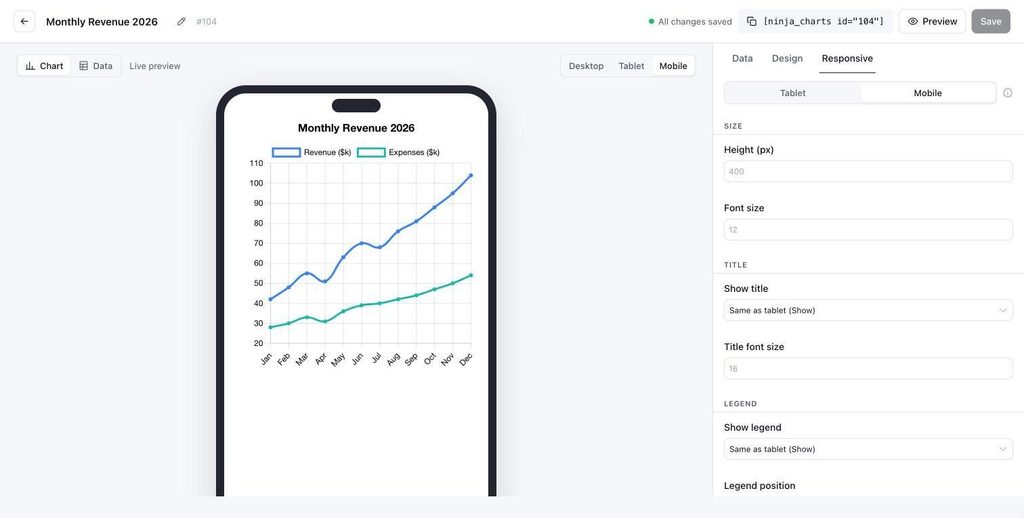
The device preview frames showing a chart on desktop, tablet and mobile
3. See where each chart is used
The chart list now shows where every chart is embedded, so you know which pages use it before you change or delete it. New filters help you find the chart you need faster.
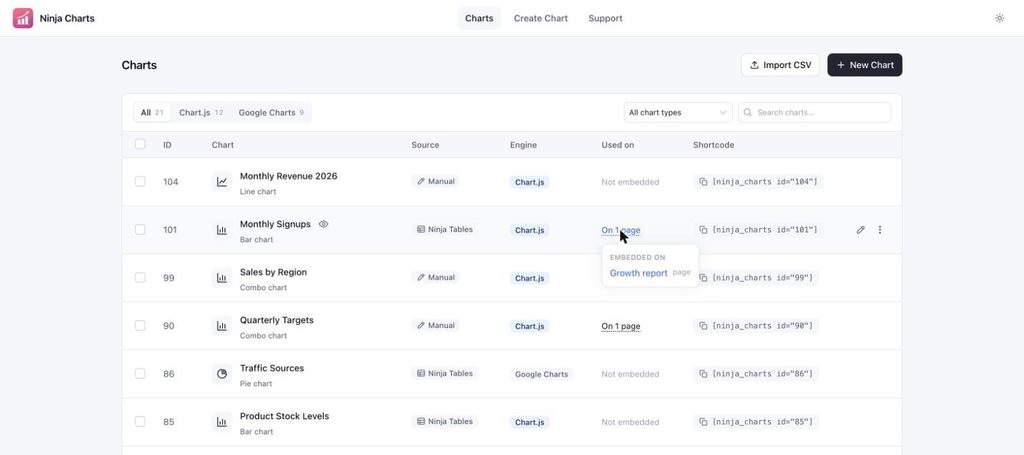
The chart list with the usage column and filters
4. A tidier Design tab
The Design settings are grouped into clear sections, with fields two to a row and short tips next to them. If changing the chart type would lose some of your settings, Ninja Charts asks first.
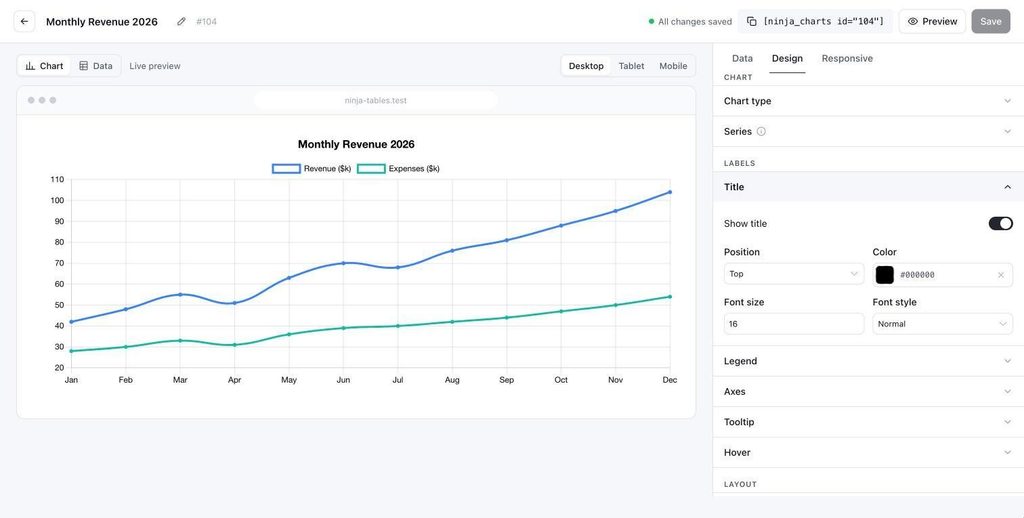
The grouped Design tab with fields two to a row
5. Easier manual data and CSV import
Manual chart data now opens in a full-size data sheet, so editing many rows is comfortable. The CSV import has a new look with clearer guidance on how to set up your file.
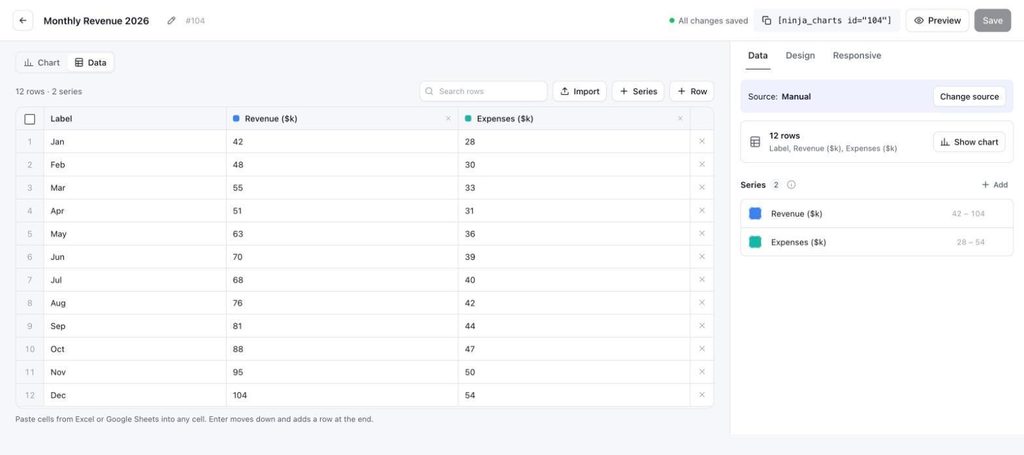
The full-size data sheet for manual chart data
6. New welcome and Support screens
First-time users get a friendly welcome screen, and the Support page now includes FluentCart. Doc links take you straight to our new docs site.
Fixes and improvements
Ninja Tables
Tables using the DataTables engine now load their rows. If your chart pulled data from a Ninja Tables table that uses the DataTables engine, the chart could show up empty. It now reads every row as it should.
Chart display
Bar charts no longer show “None” on hover, and combo charts draw correctly. Hovering over a bar now shows the right label, and combo charts show each part in its right place.
The grid switch is back for pie, doughnut, polar area and radar charts. You can turn grid lines on or off for these charts again.
A tooltip border of 0 is respected. Setting the tooltip border to 0 now removes the border, as you’d expect.
Admin
Editing a chart from a link opens the right chart. When only the chart ID in the address changed, the builder could keep showing the old chart. It now loads the one you asked for.
No more light flash in dark mode. The dark theme now loads before the page shows, so the screen no longer flashes white.
Other
A modern build behind the scenes. We moved our build tooling from Laravel Mix to Vite. We also added a translation template, so you can translate Ninja Charts into your language.
Why This Update Matters
Charts should be quick to make and easy to get right. With a live preview, plain-word data setup and per-device settings, you spend less time fiddling and more time sharing your data. And your existing charts keep working, so there’s nothing to redo.
How to Update
Go to your WordPress dashboard, open Plugins, find Ninja Charts and click Update now. You can also download the latest version from WordPress.org.
Update Ninja Charts and Get Started!
That’s it for 3.5.0! Update today, open the new builder, and try making a chart. We’d love to hear what you think, and if Ninja Charts helps you, please leave us a rating on WordPress.org.
For the full list of changes, see the changelog. Happy charting!

Ninja Tables– Easiest Table Plugin in WordPress



Add your first comment to this post