Grow Your Business with WordPress Tables (2026)
You want your desk clean, trash separated, and room organized. Obviously you want your website to look the same way…
Get This Special Discount!
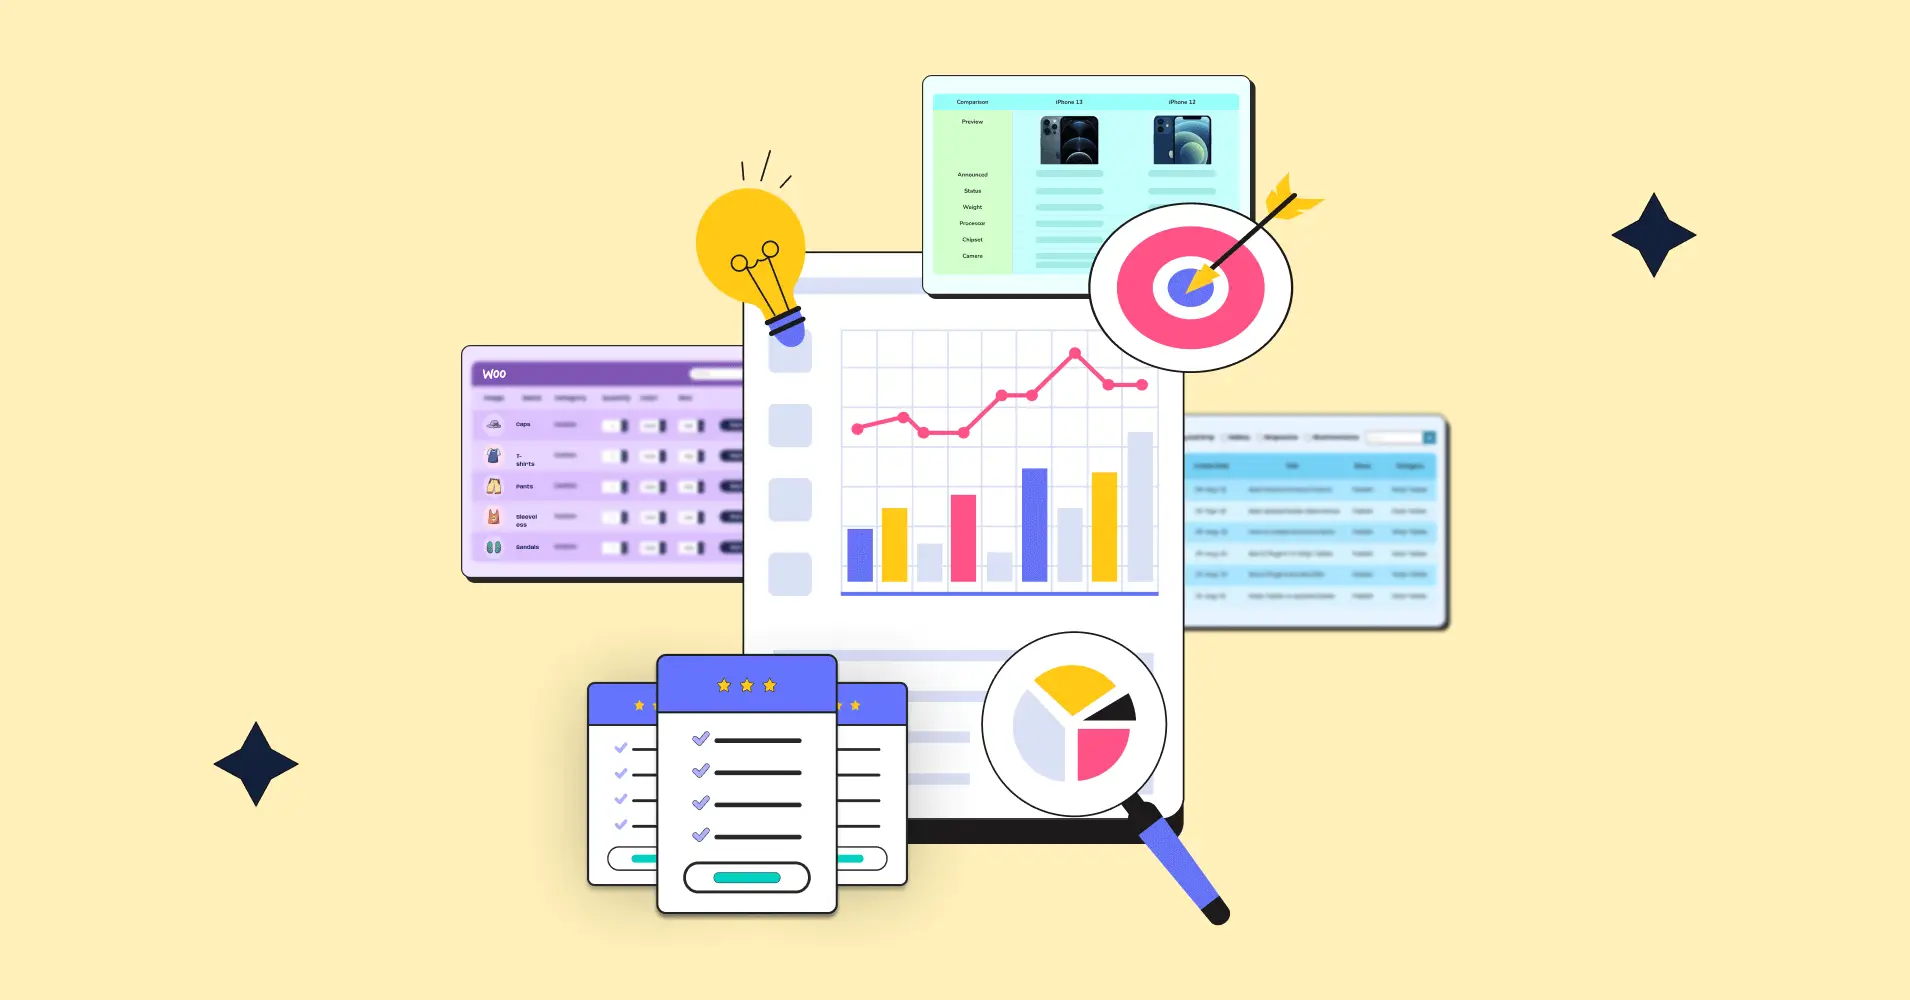
Unleash the power of Data Visualization! Explore techniques, tools, and insights to transform complex data into compelling visual stories. Enhance your understanding and communication.
You want your desk clean, trash separated, and room organized. Obviously you want your website to look the same way…

Does it ever happen to you- you’re seeing numbers after numbers, data thrown at you like bullets, you’re in the…

Doom scrolling or browsing with a purpose, we all want information and details handed on a platter to engage with…

Ever stared at a static spreadsheet and wished it could tell a better story? Enter interactive data visualization- your knight…

Colors, layout, or images – A WordPress table stands out with these when you customize it. For the table to…

To tackle market uncertainties and make evidence-based decisions, statistical analysis is the cornerstone in the high-tech and business sectors. Businesses…

Cinéphile or not! You’ll most definitely know a Wes Anderson movie scene from miles away. That eclectic color palette is…

We’re stepping into 2026 and if you’re still confident with your data visualization trends knowledge, it’s time to reassess! There…

Charts and tables – A timeless rivalry! These two powerhouses of data visualization have long battled for supremacy. We set…
In Brent Dykes’s book, Effective Data Storytelling he says: “Data visualization is not just about pretty pictures; it’s about telling…