Industry Sectors Leveraging Big Data (What It Means for WordPress)

The original idea behind big data was simple: collect more, decide better. What nobody fully predicted was how differently every industry would apply that principle. Every sector that has seriously touched big data in the last five years has a story to tell. The common thread across all of them is the same: big data stopped being a buzzword and started being an operational part every day.
But there’s a gap that rarely gets discussed. Organizations generating and analyzing massive datasets still need to display that data somewhere. Reports get published. Dashboards go live. Directories, catalogs, and records land on WordPress sites. And that’s where things typically break down.
This article covers the sectors doing the most meaningful work with big data today, why they’re doing it, and what it actually takes to handle large-volume data without sacrificing performance.
TL;DR
- The global big data market is valued at over $224 billion in 2025 and is growing fast
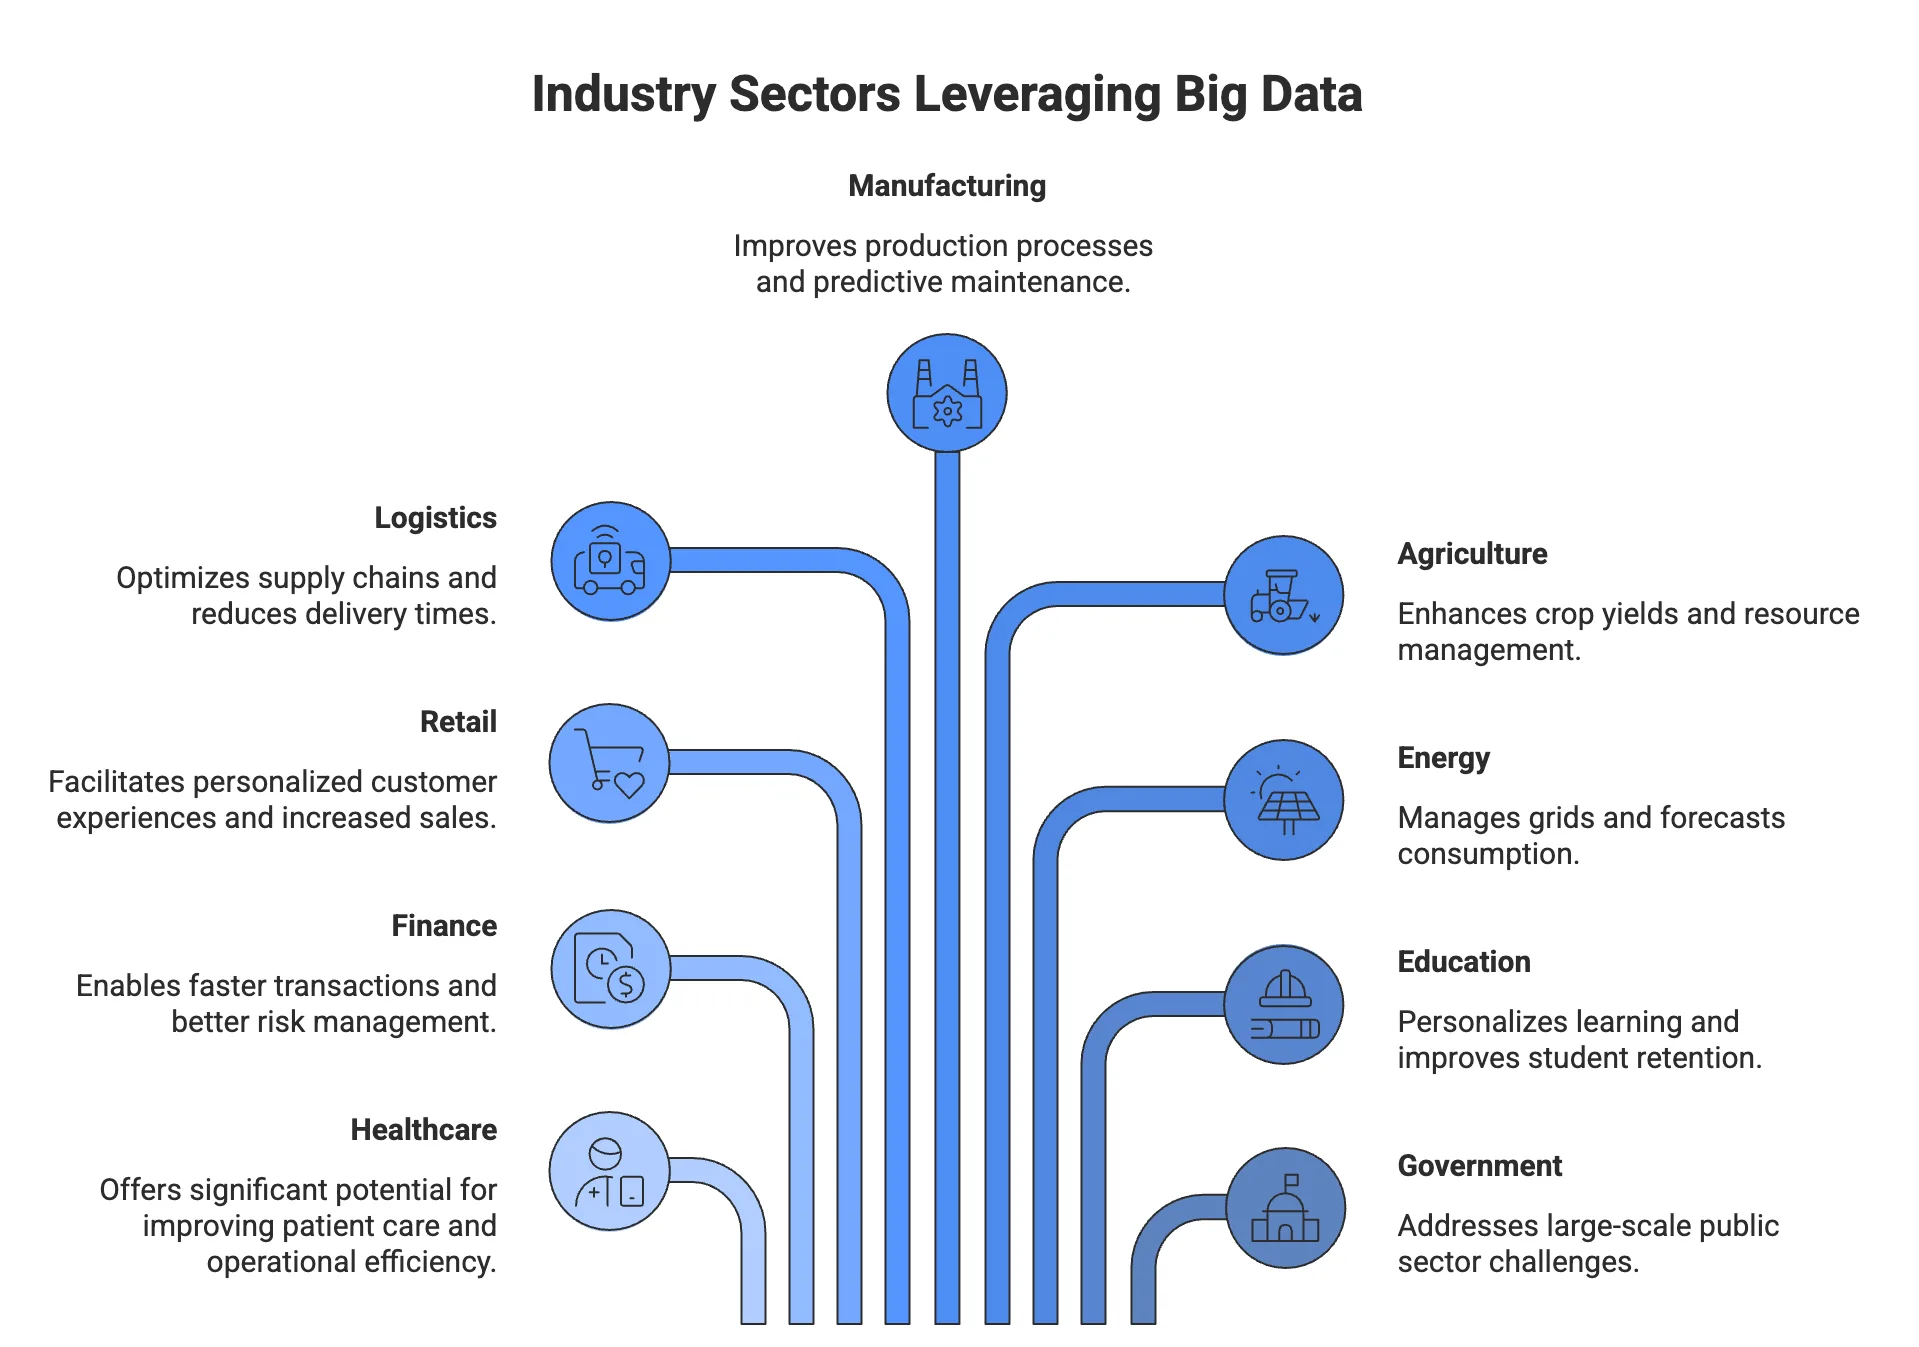
- Healthcare, finance, retail, logistics, manufacturing, agriculture, energy, education, and government are the leading sectors driving big data adoption
- Each sector uses data differently: some for prediction, some for optimization, some for personalization
- Most WordPress environments break when asked to display thousands of rows of live data
- Ninja Tables introduces a DataTables rendering engine with server-side AJAX pagination, solving the big data display problem natively inside WordPress
- This matters for any WordPress site publishing data-heavy content: product catalogs, research tables, financial datasets, directories, and more
What Is “Big Data” and Why Does It Keep Coming Up?
Big data refers to datasets so large and complex in volume, velocity, and variety that traditional data management tools cannot process them effectively. The term captures three foundational properties: the sheer quantity of data being generated, the speed at which it arrives, and the mix of structured and unstructured formats it takes.
In practice, big data is not defined by a specific row count. It is defined by whether the data exceeds what standard tools can handle without purpose-built infrastructure. A hospital managing millions of patient records, a telecom provider tracking call activity across millions of users, or a retailer monitoring real-time inventory across thousands of locations; each of these is a big data scenario regardless of the exact volume.
That growth is not evenly distributed, though. Some sectors are much further along than others, and the reasons vary by use case, regulation, and data infrastructure maturity. According to Data Ideology, 83% of enterprise executives say big data initiatives are pursued directly for competitive advantage, and insights-driven businesses are growing at more than 30% annually.
Where Big Data Is Actually Making a Difference
Big data looks different in every sector because the problem it solves is different in every sector. Some industries need speed above all else. Others need pattern recognition across decades of historical records. Some are shaped heavily by regulation, which dictates what data can be collected and how it can be used. Others are still building the data infrastructure before the analytics layer can run at all.
A Quick Note Before We Get Into the Sectors
This article covers big data applications across ten industries. Several of those industries, like healthcare, retail, finance, and government, eventually face the same downstream problem: publishing large structured datasets on WordPress without performance falling apart.
Ninja Tables is built for exactly that. If you already know you are dealing with large-volume data on a WordPress site, the big data rendering in Ninja Tables is where to start. Server-side rendering, column-level filtering, and chunk-based CSV import — all inside the plugin, no custom development required.
The 9 big data sectors below represent the clearest examples of massive data shifting from capability to operational reality; each with a distinct use case, a distinct data challenge, and a distinct answer to the question of what the data is actually for.
Healthcare: Where big data has the most obvious stakes
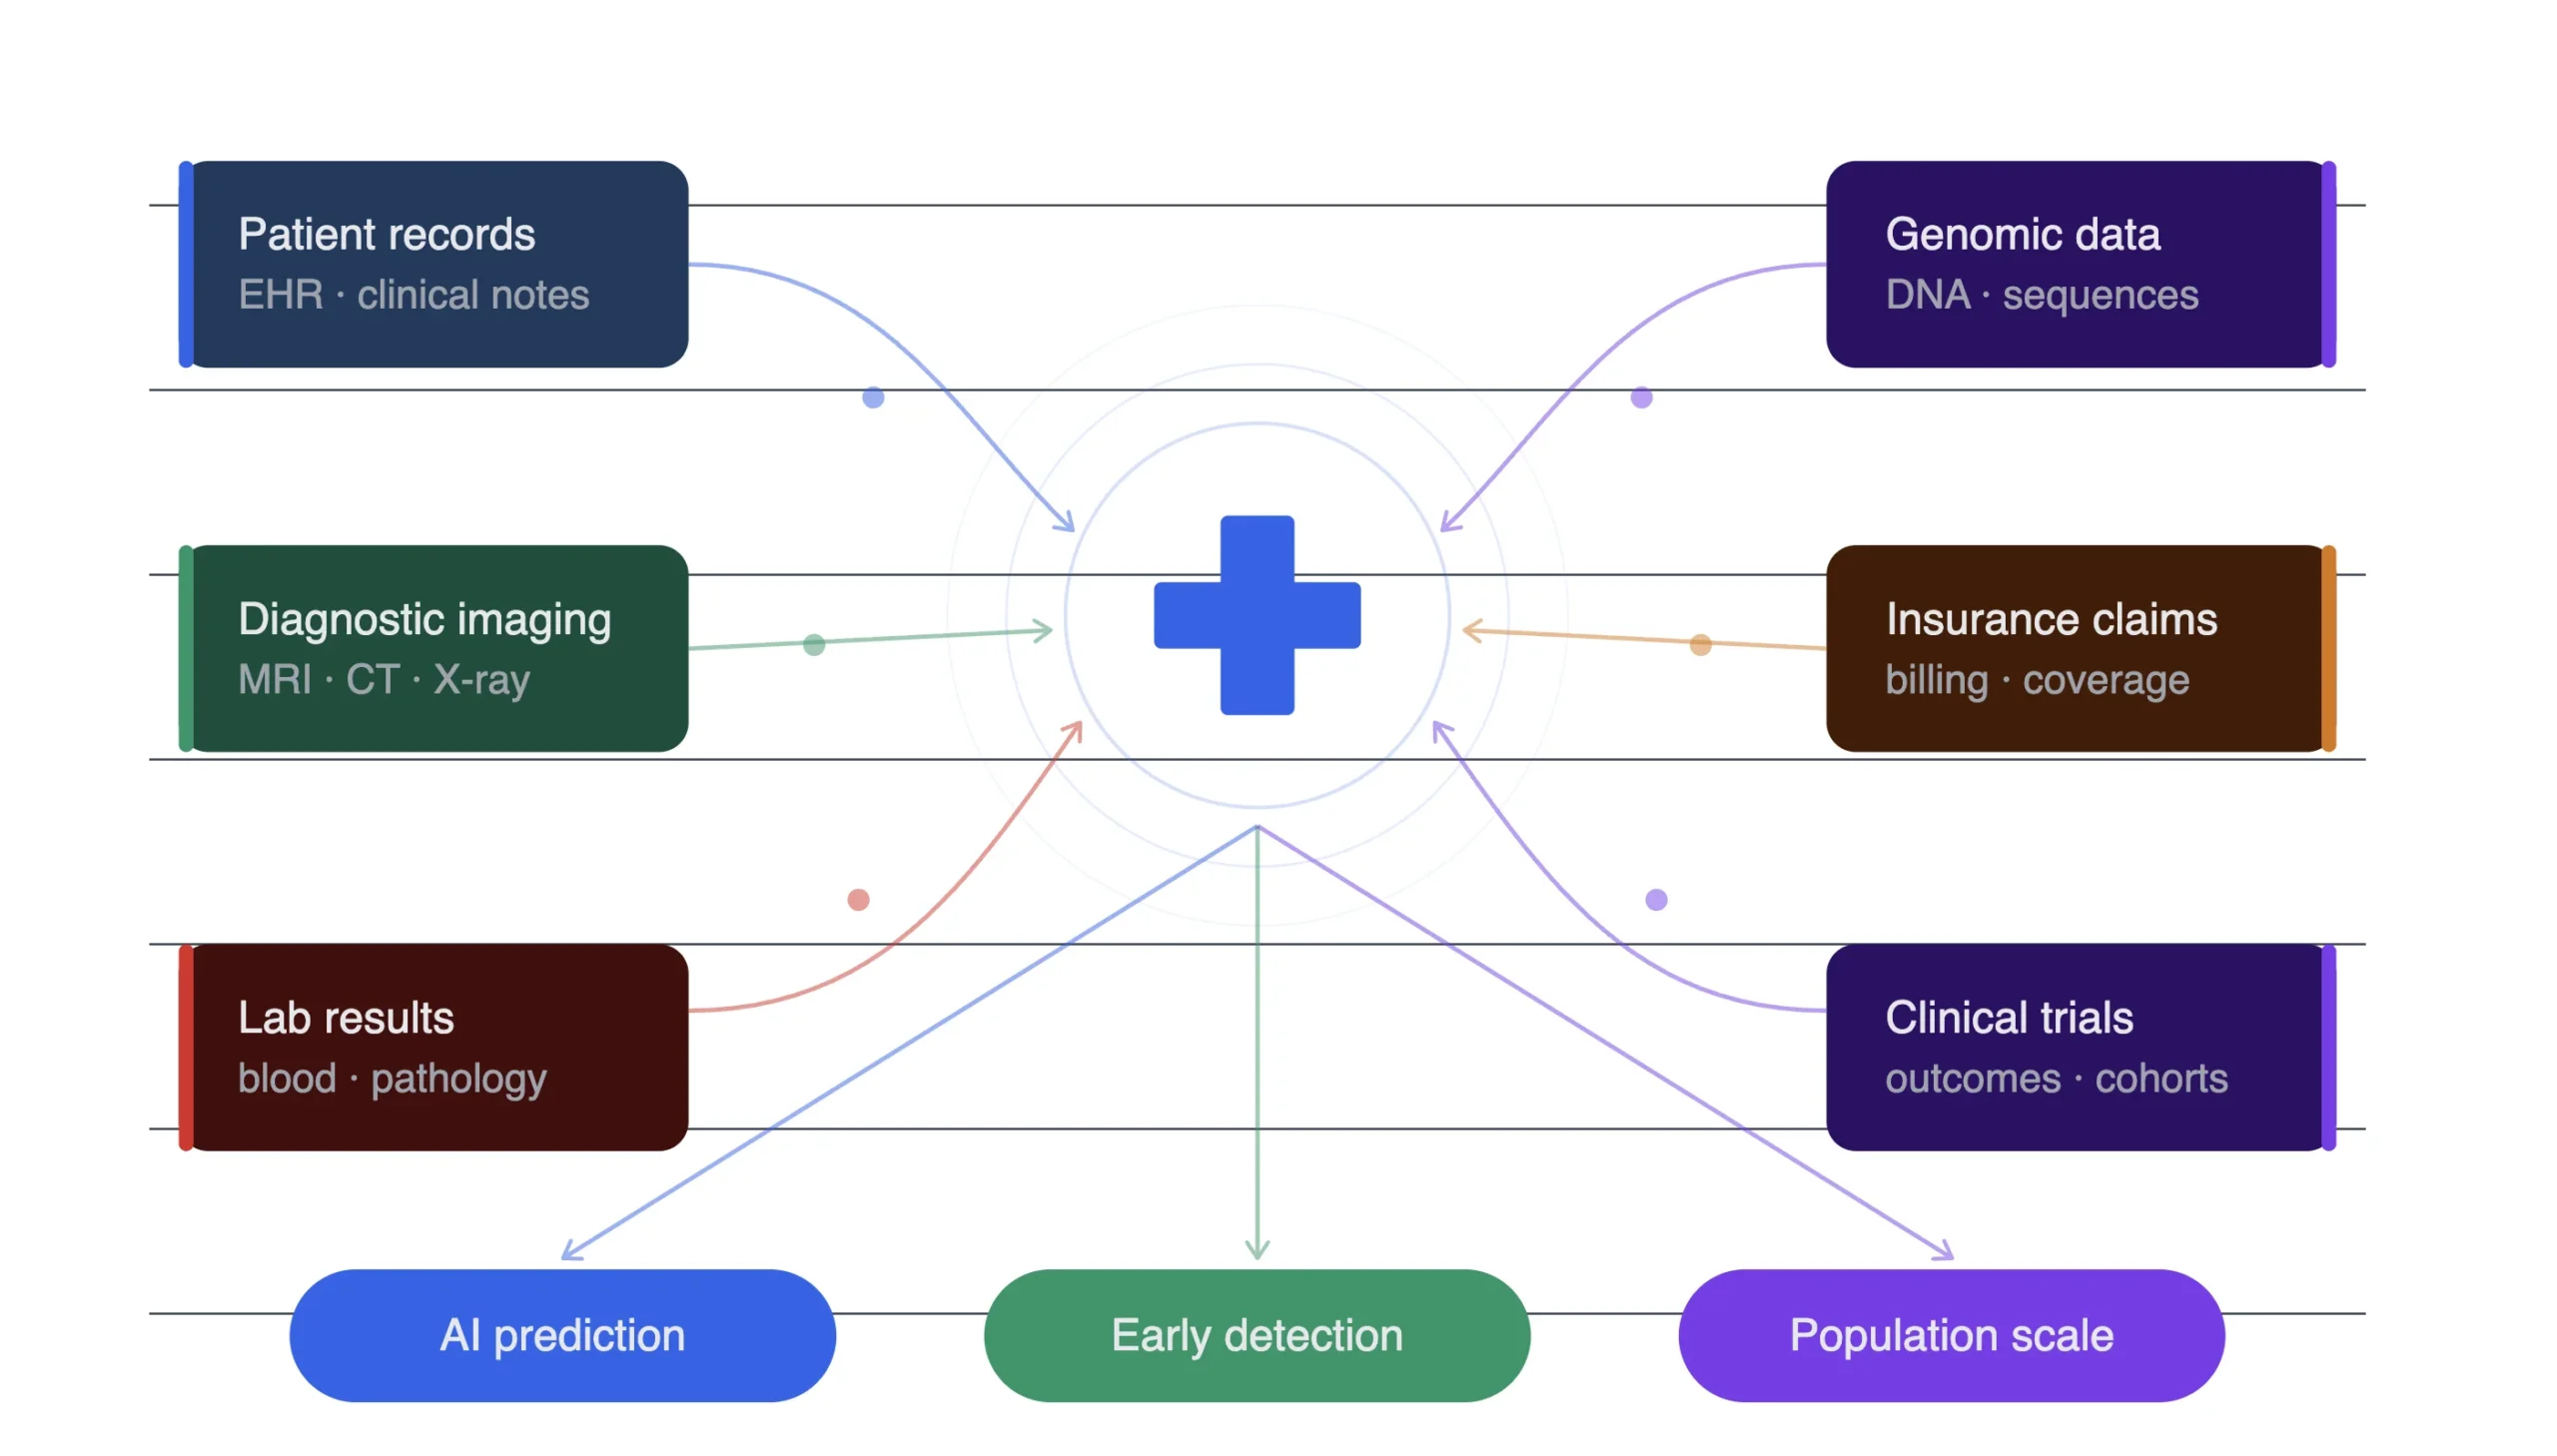
Healthcare sits at the most consequential end of big data applications. Patient records, diagnostic imaging, genomic sequences, lab results, clinical trials, and insurance claims collectively generate data volumes that no manual process could manage.
The practical outcomes are well-documented. AI algorithms running on electronic medical records identify disease patterns earlier than traditional screening methods. Predictive models flag high-risk patients before symptoms escalate. Medication interaction data gets cross-referenced in seconds rather than hours.
For healthcare organizations publishing data on public-facing platforms, particularly research institutions or hospital networks displaying clinical statistics, the challenge is presenting complex, structured datasets in readable, filterable formats without overwhelming infrastructure.
Finance: Speed, risk, and algorithmic precision
Financial services have been working with large datasets longer than most sectors, but the scale and sophistication have shifted significantly. The use cases now run from high-frequency algorithmic trading to real-time fraud detection to customer credit scoring.
The downstream effect for WordPress-based financial content: regulatory filings, rate tables, fund performance data, and market comparisons published on institution websites now involve datasets that standard table plugins cannot handle cleanly.
Retail and e-commerce: Personalization at scale
Retail has benefited from big data in a way that’s directly visible to consumers. Every product recommendation on a major platform, every dynamic pricing update, every inventory reorder is driven by real-time data analysis.
Inventory management is another application where the data advantage is clear. Retailers running predictive analytics on supply chain data significantly reduce overstock and understock situations. They know which products to reorder weeks before the shelf empties, based on sales velocity, supplier lead times, and seasonality.
For e-commerce sites built on WordPress with WooCommerce, product catalog management at scale runs into performance walls quickly. A few hundred products display without issue. A catalog with tens of thousands of items, multiple attributes, and live inventory data needs a different rendering approach entirely.
Logistics and transportation: Efficiency measurement
Logistics companies run on data. Route optimization, fleet management, driver performance, package tracking, fuel consumption, compliance monitoring, and warehouse inventory are all data-intensive operations running simultaneously.
The classic example is UPS, which implemented a routing algorithm based on data analysis of driver behavior patterns. The analysis showed that left turns across traffic were causing systematic inefficiency. The resulting policy shift, routing drivers to avoid left turns where possible, produced fuel savings of approximately 10 million gallons annually and reduced carbon dioxide emissions by around 20,000 tons per year. That outcome came entirely from reading patterns in data that already existed.
Manufacturing: Predictive systems and production
Manufacturing’s relationship with big data centers on uptime and quality. Industrial IoT sensors embedded in machinery generate continuous data streams: temperature, pressure, vibration, output rate, and error rate. Analyzed in real time, this data allows predictive maintenance systems to catch equipment failures before they happen.
Supply chain resilience has also become a major focus post-2020. Manufacturers using advanced data analytics on supplier relationships, lead times, and geopolitical signals are better positioned to anticipate disruptions and reroute sourcing accordingly.
Agriculture: Precision farming and crop intelligence
Agriculture might be the least expected sector in this list, but precision farming has made big data an active field in crop science, resource management, and yield prediction.
Predictive yield modeling uses historical harvest data combined with current season inputs to forecast output, giving agricultural businesses better visibility into supply chain planning. At the enterprise level, data platforms are helping agribusinesses manage thousands of acres as a connected system rather than isolated plots.
Energy and utilities: Management and forecasting
Energy companies use big data across two primary dimensions: grid management and demand forecasting. Smart meter networks generate granular consumption data at the household level continuously, creating datasets that enable dynamic pricing, load balancing, and infrastructure planning with a precision that was previously impossible.
Utilities also use consumption data for predictive maintenance of infrastructure. Analyzing patterns in substation performance data can identify transformer degradation before failure, avoiding outages that would otherwise affect large areas.
Education: Big data management and analytics
Educational institutions generate substantial data from student performance, engagement metrics, assignment completion rates, and assessment results. The shift from uniform curriculum delivery toward personalized learning pathways is driven almost entirely by data.
For research institutions publishing datasets, performance comparisons, and enrollment analytics on web platforms, the challenge is keeping data tables functional as datasets grow across years of accumulated records.
Government and public sector
Government operates at a data scale that dwarfs most private sector organizations. Census data, tax records, public health surveillance, infrastructure monitoring, law enforcement records, and social services databases represent datasets that span decades and cover entire populations.
The United Nations reports that over 100 countries have established national data strategies specifically to improve governance, urban planning, and disaster response. Smart city initiatives use sensor networks across transportation, utilities, and public safety infrastructure to optimize services in real time.
Public data portals, which publish government datasets for citizen and researcher access, face the most demanding version of the web data display problem. The data is real, it is extensive, and it needs to be accessible and searchable to the public. Standard web table solutions fail at this scale.
The Gap Nobody Talks About: Displaying Big Data
Every sector covered above eventually needs to put its data somewhere a user can see it. Research findings go on websites. Regulatory filings become published tables. Product catalogs live in front-end displays. Financial dashboards appear on client portals. Government datasets get published to public portals.
This is where the real-world problem sits. Standard WordPress table plugins render data client-side: all rows load into the browser at once, and JavaScript handles sorting, filtering, and pagination. For tables under a few hundred rows, this works fine. For anything beyond that, performance degrades quickly. A table with 50,000 rows can take several seconds to load. Sorting triggers a full DOM re-render. Filtering parses every row in memory. On mobile or slower connections, the table becomes unusable.
The options were limited for a long time: purpose-built enterprise data grid tools outside WordPress, or accepting a hard performance ceiling inside it.
That ceiling just moved.
How Ninja Tables Handles Big Data Display Inside WordPress
Ninja Tables 5.2.8 introduces DataTables as a fully integrated alternative rendering engine inside the plugin. This is not a cosmetic update. It is a change to how data is processed at the architectural level.
DataTables is a widely used jQuery plugin with a well-established server-side processing protocol. When server-side mode is active, every table interaction — page navigation, sort, search, filter — triggers an AJAX request to the server. The server handles the query and returns only the current page of results. The browser never holds the full dataset.
What this means practically:
- Sorting becomes an ORDER BY clause in the database rather than a JavaScript operation in memory.
- Filtering becomes a WHERE clause rather than a loop through every loaded row.
- Pagination becomes LIMIT and OFFSET rather than a page slice of a fully loaded array.
The result is a table that performs the same whether it is displaying 500 rows or 500,000. Browser load stays constant. Interaction speed stays fast regardless of data volume.
What’s included:
- DataTables rendering engine — selectable per table, leaving existing tables unaffected
- Server-side AJAX pagination — no full dataset in the browser
- Column-level filtering — text, number range, and date range filters per column
- Mobile-first responsive layouts — works across devices with large datasets
- Chunk-based large CSV import — handles very large files on shared hosting without hitting PHP memory limits
- Large File Source option — point to a CSV in your WordPress Media Gallery for datasets too large for standard upload
Configuration happens entirely through the existing Ninja Tables settings interface. You select the rendering engine, configure columns, and the server-side processing runs internally. No AJAX handlers to write. No DataTables initialization to manage manually.
For a detailed look at what this rendering architecture change means before choosing a solution, Big Data Tables in WordPress: What Works and What Breaks covers the performance ceiling in detail and what moves it.
Ninja Tables for big data WordPress use cases:
- Healthcare portals publishing clinical research data or automating patient data in tables
| No | Appointment | Patient's Name | Gender | History | Treatment Type | Phone No | E-mail Address | Date of birth | Attendee |
|---|---|---|---|---|---|---|---|---|---|
| 1 | 5/10/2025 10:0 AM | Rick Nielson | Male | New Visit | Routine Check | +1 212 555 4567 | [email protected] | 3/16/1989 | No |
| 2 | 5/11/2025 11:0 AM | Pamela Tov | Female | Revisit | Crowns | +1 212 555 8756 | [email protected] | 7/22/1980 | Yes |
| 3 | 5/17/2025 11:0 AM | Jim Anderson | Male | New Visit | Bone Grafting | +1 212 666 2768 | [email protected] | 8/24/1996 | Yes |
| 4 | 5/21/2025 2:0 PM | Stanley Cooper | Male | New Visit | Scalling & Polishing | +1 212 555 3111 | [email protected] | 12/2/2000 | No |
| 5 | 5/14/2025 3:0 PM | Allison Sydney | Female | New Visit | TMJ Treatment | +1 212 777 3218 | [email protected] | 11/28/1997 | No |
| 7 | 5/14/2025 12:0 AM | Harvey Spencer | Male | Revisit | Dental Emergencies | +1 212 555 9034 | [email protected] | 2/17/2003 | Yes |
- Financial sites displaying pricing tables, rate comparisons, or fund performance history
 Pricing: Product X
Released: July 2025
Seller: ElectroMag
| Plan | Monthly | Annually | You save | USP | Action |
|---|---|---|---|---|---|
Agency | $159 | $1590 | 10% | 24/7 support | Buy |
Professional | $79 | $790 | 20% | AI infusion | Buy |
Starter | $29 | $290 | 17% | Drag-and-drop | Buy |
- E-commerce catalogs with thousands of products and multi-attribute filtering
| Image | Name | Category | Price | Choose | |
|---|---|---|---|---|---|
 | Blue Hoodie (Zipper) | Hoodies | Original price was: $40.00.$35.00Current price is: $35.00. | | |
 | Hat | Hat | Original price was: $20.00.$15.00Current price is: $15.00. | | |
 | T Shirt | Half sleeve | $45.00 | | |
| T-Shirt with Logo | Tshirts | Original price was: $10.00.$8.00Current price is: $8.00. | | ||
| Beanie with Logo | Accessories | Original price was: $20.00.$18.00Current price is: $18.00. | | ||
 | T-Shirt | Tshirts | $18.00 | | |
 | Long Sleeve Tee | Tshirts | $25.00 | | |
 | Polo | Tshirts | $20.00 | | |
| Hoodie with Logo | Hoodies | $45.00 | | ||
 | Hoodie with Pocket | Hoodies | Original price was: $45.00.$35.00Current price is: $35.00. | | |
 | Hoodie with Zipper | Hoodies | $45.00 | | |
 | Beanie | Accessories | Original price was: $20.00.$18.00Current price is: $18.00. | | |
 | Belt | Accessories | Original price was: $65.00.$55.00Current price is: $55.00. | | |
 | Cap | Accessories | Original price was: $18.00.$16.00Current price is: $16.00. | | |
 | Sunglasses | Accessories | $90.00 | | |
 | Tank Top | Tanktop | Original price was: $45.00.$40.00Current price is: $40.00. | |
- Education dashboards showing historical performance across programs and years
Overall Progress Report
Alaina Malkovic
Grade-9
| Category | Task / Subject | Status | Grade | Remarks |
|---|---|---|---|---|
| Academic Subjects | Mathematics | In Progress | B+ | Needs review on algebra |
| English Literature | Completed | A | Excellent essays and comprehension | |
| Science | In Progress | B | Focus on lab reports | |
| History | Completed | A- | Good contextual understanding | |
| Computer Science | Not Started | N/A | Scheduled next term | |
| Assignments | Term Paper (History) | Submitted | A | Well-researched and structured |
| Math Workbook | In Progress | N/A | Needs consistent work | |
| Science Project | Submitted | A | Outstanding effort | |
| Extra Activities | Debate Club | Active Member | N/A | Shows leadership and confidence |
| Music Class | Completed | N/A | Learned piano basics | |
| Field Trip Reflection | Submitted | B+ | Thoughtful responses | |
| Behavior & Effort | Classroom Behavior | Excellent | N/A | Polite and engaged |
| Participation | Very Good | N/A | Active in discussions | |
| Homework Consistency | Good | N/A | Occasionally late | |
| Overall Summary | — | — | Solid progress; improvement in math will boost performance further |
- Employee directory tables for companies with multiple branches and overseas collaboration.
| Business Name | Category | Location | Contact Number | Website | Hours of Operation |
|---|---|---|---|---|---|
| Barton Creek Café | Restaurant | Downtown Austin | (512) 555-1023 | bartoncreekcafe.com | 8 AM – 9 PM |
| Capitol Smiles Dental | Dental Clinic | North Austin | (512) 555-2045 | capitolsmiles.com | 9 AM – 5 PM |
| ATX Tech Pros | IT Services | East Austin | (512) 555-3124 | atxtechpros.com | 10 AM – 6 PM |
| Lone Star Legal Group | Legal Services | South Congress | (512) 555-4456 | lonestarlegalgroup.com | 9 AM – 6 PM |
| Bloom & Vine Florist | Florist | Zilker | (512) 555-5876 | bloomandvineaustin.com | 10 AM – 7 PM |
| CoreStrength Gym | Fitness Center | Mueller District | (512) 555-6732 | corestrengthgym.com | 6 AM – 10 PM |
| Travis County Vets | Veterinary Clinic | Westlake Hills | (512) 555-7890 | traviscountyvets.com | 8 AM – 8 PM |
| Book People | Bookstore | Downtown Austin | (512) 555-8923 | bookpeopleaustin.com | 10 AM – 9 PM |
| Wild Hair Salon | Beauty Salon | South Lamar | (512) 555-4567 | wildhairaustin.com | 9 AM – 7 PM |
| The Repair Guys | Electronics Repair | North Loop | (512) 555-3344 | therepairguysaustin.com | 10 AM – 8 PM |
| Verde Accounting | Accounting Services | Barton Hills | (512) 555-2201 | verdeaccounting.com | 9 AM – 5 PM |
| Fresh Market Co-op | Grocery Store | Hyde Park | (512) 555-9988 | freshmarketaustin.com | 8 AM – 8 PM |
| Austin Pet Groomers | Pet Services | Allandale | (512) 555-6110 | austinpetgroomers.com | 9 AM – 6 PM |
| Capital Cleaners | Dry Cleaning | Clarksville | (512) 555-7333 | capitalcleanersaustin.com | 8 AM – 7 PM |
| The Yoga Nest | Wellness Studio | East Cesar Chavez | (512) 555-4450 | theyoganestaustin.com | 6 AM – 9 PM |
| Moonlight Music Studio | Music Lessons | Travis Heights | (512) 555-9123 | moonlightmusicaustin.com | 11 AM – 8 PM |
| GreenThumb Landscaping | Landscaping Service | Tarrytown | (512) 555-2745 | greenthumbaustin.com | 7 AM – 5 PM |
- Real estate listings / Finance managing property listing directories, filterable by price/type/location
 $2,750,000 22 Pinecrest Avenue |  $2,950,000 310 Willow Creek Rd |  $2,890,000 47 Harbour Blvd | |
Beds & Bath | 4 Bed 4 Bath | 5 Bed 6 Bath | 5 Bed 5 Bath |
Size | 3,000 – 3,400 sqft | 3,800 – 4,200 sqft | 3,500 – 3,900 sqft |
Maintenance Fee | $650.20 | ||
Days on Market | 12 days | 30 days | 8 days |
Tax | $12,480/2026 | $13,950/2025 | $13,120/2025 |
Parking | 2 spots | 4 spots | 3 spots |
Outdoor Space | Terrace, Garden | Pool, Deck, Patio | Balcony, Rooftop Terrace |
Exposure | South | West | East |
Property Type | Detached | Detached Luxury | Condo Penthouse |
Furnished | |||
Estimated Mortgage | |||
|
|
|
|
Neighbourhood | |||
Neighboring Area | Avg Price/sqft | Last Year Growth | Explore |
Forest Hill | $725/sqft | 3.2% up | |
Bayview Glen | $910/sqft | 6.8% up | |
King East | $980/sqft | 5.1% up | |

- Research institutions publishing large structured datasets for public access
- Government data portals that are making large public datasets searchable
Wrapping Up
Big data is not a technology story anymore. The use cases vary widely; some sectors use data for early detection, some for personalization, some for precision and speed, but the underlying dynamic is consistent across all of them: organizations that activate their data outperform those that only collect it.
What does not get discussed enough is the final mile. Analysis that stays in a dashboard reaches only the people who have access to that dashboard. Data that gets published — in readable, filterable, performant tables on websites — reaches patients, clients, researchers, customers, and citizens. That layer matters. And it needs infrastructure capable of handling the volume it carries. In WordPress Ninja Tables, that clarity is brought to users who believe in performance, compliance, and the best user experience.
Ninja Tables– Easiest Table Plugin in WordPress


Add your first comment to this post