
When Your WordPress Table Plugin Is Wrong for Your Data

You installed a table plugin, built the table, and something still does not work. Users are confused, the page crawls, or the data sits there doing nothing useful. The instinct is to swap the plugin, but that is often the wrong diagnosis.
WordPress table plugin limitations tend to fall into three distinct categories. The data structure is wrong for a table format. The table type is mismatched to the task. Or the plugin’s rendering architecture genuinely cannot handle the data volume. Each one looks similar on the surface and has a completely different fix, which is why swapping plugins without diagnosing the actual problem almost always wastes time.
In this blog, we will go through how to identify which limitation you are actually dealing with, when a WordPress table is the wrong tool entirely, and what the right solution looks like for large datasets specifically.
TL;DR
- WordPress table plugin limitations fall into three categories: wrong data structure, wrong table type, and wrong rendering architecture
- Five specific data patterns that consistently fail in standard WordPress table formats, regardless of which plugin you use
- The difference between a display table and a data table, and why confusing the two creates problems no settings panel can fix
- Where client-side rendering breaks and what server-side processing actually means for large datasets in WordPress
- Why most plugins claiming “large dataset support” and genuine big data support are not the same thing
- How Ninja Tables’ DataTables rendering engine addresses the gap that has limited other WordPress table plugins for years
What a table effectively does well
Before diagnosing what is wrong, it helps to be clear about what tables genuinely do well.
A table is the right structure when users need to compare multiple attributes across multiple items simultaneously: product specs across three models, pricing tiers across five plans, player statistics across a full squad, team standings across a season. The defining feature of all these cases is that the columns mean the same thing for every row, and users need to read across rows and down columns to make sense of the data.
Tables also work well when users need to find a specific record in a larger set, which is why sorting, searching, and filtering matter so much for larger datasets. A user who knows they need the row for “Invoice #4821” or “Product SKU: WM-0094” is using the table as a lookup tool. That is a valid and common use case.
Where tables work, they work better than almost any other format. Dense, comparable, structured data presented in a well-built table is faster to read than paragraphs, more scannable than cards, and more useful than a chart when the user needs the actual values rather than a visual trend.
The problem is that most people reach for a table plugin by default, regardless of whether the data fits that structure.
Five data patterns that fail in a standard WordPress table
Each of these shows up constantly across WordPress sites, and in most cases, the table plugin gets blamed for a problem that started one layer above it.
1. Data with no meaningful comparison across rows
A table implies that every row is the same type of thing. If the rows are genuinely different in kind, not just in value, a table creates false equivalence.
A WordPress site listing “team members” with a name, role, bio, and photo does not belong in a table. Users do not need to compare Ana’s bio against Marcus’s bio. They are looking at individuals, not comparing attributes. A card layout or a custom post type with archive pages serves this far better.
The same applies to blog post listings, recipe archives, event schedules with varying structures, and testimonial collections. Each of these contains items that are meant to be read individually, not scanned comparatively. A table forces a comparative structure onto data that does not benefit from it.
2. Hierarchical or relational data
Tables are a flat structure. Each row holds one level of data, and when the data has parent-child relationships, or when records belong to categories that themselves carry properties, a flat table hides the structure rather than communicating it.
A product catalog where each product has multiple variants, each variant has its own price and stock status, and each category has display rules is relational data. Flattening it into a table either loses the relationships entirely or creates hundreds of near-duplicate rows that confuse users and slow the page.
WordPress handles relational data better through custom post types with taxonomies, or through purpose-built WooCommerce product structures. A table can be part of the display layer for these, but it should not be the structural layer.
3. Data that changes meaning without context
Some data requires explanation to be useful. A table cell that reads “47%” means nothing without knowing what it measures, over what period, against what baseline. If every cell in a column requires a tooltip, a footnote, or a hover state to be meaningful, the table is carrying data that belongs in a different format.
Research data, survey results with nuanced categories, financial metrics with complex definitions, and scientific measurements with units that vary by row all tend to fall into this pattern. Users slow down not because they cannot find the data, but because they cannot interpret it without leaving the table to look something up.
Reports, annotated data visualizations, or structured text with embedded tables for specific comparisons work better here. The table is a supporting element, not the primary container.
4. Primarily visual data
If the primary attribute users need is an image, a video, or a color, a table is usually the wrong structure.
A property listing where the first thing a user evaluates is a photo, a design portfolio where the work itself is the content, a product gallery where visual impact drives the purchase decision: none of these belong in a table. The format prioritizes text and values. Images placed inside table cells are constrained to small, fixed-dimension spaces where they compete with surrounding text rather than inviting the kind of open visual browsing that image-first content requires.
Grid layouts, gallery plugins, and card-based archives handle visual-first content correctly. A table can work as a secondary view, an option for users who want to compare specs after they have already browsed visually, but putting it as the entry point for visually driven content produces a worse experience than a simpler format would.
5. Data with too few rows to need a table
A table with three rows is almost always worse than a simple list or a short paragraph.
Three pricing options, four team members, two shipping methods: none of these need search, sorting, or pagination. The overhead of a table plugin and the rigid visual structure of a grid add complexity without adding anything useful to the reader’s experience. A simply styled list or a short descriptive paragraph serves this data better and loads faster with no plugin required.
When the table type is wrong
Assuming the data does belong in a table, the next most common mismatch is using the wrong kind of table for the task.
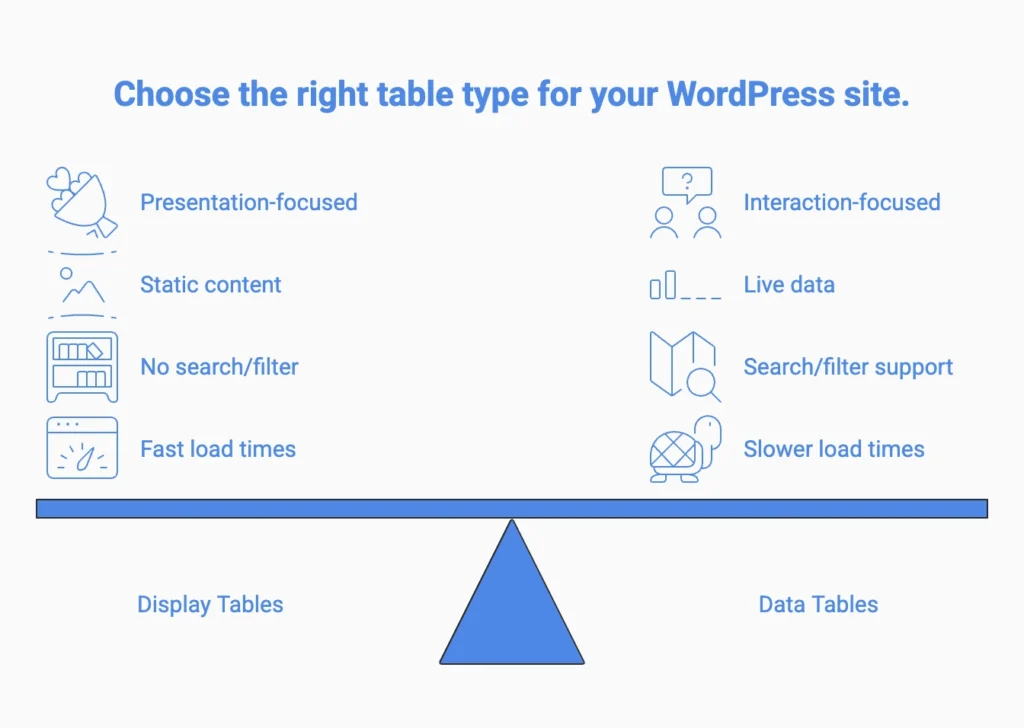
WordPress table plugins broadly fall into two categories, display tables and data tables, and most site owners treat them as equivalent when they serve fundamentally different purposes.
A display table is built for presentation: static content entered manually, formatted for a reader who will scan it once. Pricing tables, feature comparison tables, and simple informational grids all fit here. They do not need search or live data connections, just clean formatting and fast load times.
 |  |  |
A smartwatch with a polished silver case paired with a classic brown leather strap. | An elegant rose-gold smartwatch with a soft blush strap and delicate dial details. | A fresh and modern smartwatch with a cool silver case and soft sky-blue dial. |
Classic brown | Blush pink | Sky blue |
$199 | $179 | $219 |
Details | ||
Display | ||
Always-On square display | Slim square display | Wide square display |
Classic analog dial | Elegant minimal dial | Modern numeric dial |
Case & Size | ||
42mm case size | 40mm case size | 44mm case size |
Stainless steel case | Rose gold aluminum case | Polished silver aluminum case |
Reinforced glass display | Scratch resistant glass | Edge-to-edge glass display |
Strap | ||
Premium leather strap | Soft leather strap | Silicone sport band |
Breathable stitched design | Lightweight and flexible | Soft-touch sport fit |
A data table is built for interaction. It connects to a live data source, supports search and filtering, handles pagination, and updates when the underlying data changes. Product catalogs, inventory tables, financial records, and membership directories are data table use cases, where functionality determines whether the table is useful and visual styling is a secondary concern.
Building a data use case on a display table plugin means users cannot search, cannot filter, and have to scroll through everything manually. Building a display use case on a data table plugin adds configuration overhead and slower load for capabilities the table will never use.
The decision tables, data tables, and display tables breakdown covers this distinction in more depth. It is worth reading before choosing a plugin type, not after.
When the table plugin is the bottleneck
Most of the time, the problem is not the plugin. But when it is, it almost always comes down to volume, integration, or rendering architecture, and these three things are not equally common.
Sometimes the data is right for a table, the table type is correct, and the plugin is still the problem, though this tends to happen in more specific situations than most people expect.
Volume is the most common one. Standard WordPress table plugins process data on the client side, meaning every row gets sent to the browser, JavaScript handles sorting, filtering, and searching from there. This works cleanly up to a few hundred rows, starts to slow noticeably in the low thousands, and above ten thousand rows tends to fail in ways users experience as a broken page rather than a slow one.
If your table is slow and the data is structured correctly and the table type fits the task, the plugin’s processing architecture is the issue rather than the configuration. The fix is a plugin built for server-side processing, where the database handles queries and only the requested slice of data goes to the browser.
Integration is the second situation. A table that needs to stay in sync with a Google Sheet, pull from WooCommerce product data, or reflect live form submissions needs a plugin built for live data connections. A static table plugin with a CSV import will not maintain those relationships. Data goes stale the moment it is imported, and there is no mechanism to keep it current.
The third is rendering, and this is where most WordPress table plugins stop being honest with you.
When “large dataset support” is not the same as big data support
Most plugins that claim large dataset support mean they can handle a few thousand rows without crashing. That is a reasonable baseline, but it is not what organizations dealing with genuine data volume actually need.
A research institution exporting 80,000 patient records. A manufacturer pulling 200,000 component entries from an ERP system. A SaaS business displaying a client’s full transaction history spanning two years and 500,000 rows. For these use cases, client-side rendering is not slow. It is architecturally incapable.
What these cases require is a rendering engine that never holds the full dataset in the browser at all. Every user interaction, whether it is a page turn, a column sort, or a filter applied, sends a request to the server. The server queries the database, returns only the relevant page of results, and the browser renders that slice. The browser stays light regardless of whether the underlying table has 5,000 rows or 5 million.
This is server-side processing in the strict sense, and most WordPress table plugins do not have it. They have client-side rendering with pagination layered on top, which still requires the full dataset to load before the browser can split it into pages. The distinction matters enormously at scale.
What to look for when your data is genuinely large
When a table’s row count is heading into the tens of thousands or beyond, the questions change. It is no longer about which plugin has the best styling options or the cleanest UI. The questions become: does this plugin use true server-side processing or AJAX pagination where the database does the filtering, or is it JavaScript filtering a local dataset? Does it support chunk-based import for large files? Does the rendering engine perform identically at 500 rows and 500,000?
Until recently, the honest answer for WordPress was that no plugin fully met those criteria. The options were purpose-built enterprise data grid tools outside WordPress, or accepting the performance ceiling that client-side rendering imposes.
Ninja Tables 5.2.8 changed that. The release ships DataTables as a fully integrated alternative rendering engine inside the plugin, with complete server-side AJAX pagination built in. Each page, sort, or filter operation sends a request to the server, the database returns only the relevant rows, and the browser renders that response. The full dataset never touches the browser. Alongside that, the release includes a chunk-based CSV import system that handles large files on shared hosting without hitting PHP memory limits, so the import side and the render side are matched in architecture.
The full breakdown of what shipped, including how to configure server-side pagination, set up column-level filtering, and import large CSV files in chunks, is in the Ninja Tables 5.2.8 release notes.
A quick audit for your current table
If something is wrong with a table on your site, run through these four questions before reaching for a new plugin.
Does the data have a natural comparison across rows? If users have no reason to read across a row and compare one item to another, the table structure is probably wrong.
Do users need to interact with the data or just read it? If they only need to read it, a display table or a simpler format is sufficient. If they need to search, filter, sort, or paginate, you need a data table with the right backend.
How many rows will this table realistically reach at its maximum? If the answer is under 500, any decent plugin handles it. Between 500 and 5,000, plugin choice starts to matter. Above 5,000, the processing architecture determines whether the table works at all.
Where does the data come from, and how often does it change? Static data entered manually belongs in a display table. Dynamic data from an external source or one that updates regularly needs a live connection and a plugin built for it.
If the answers point to the table structure being wrong, no plugin fixes that. If they point to the plugin being wrong, changing plugins while keeping the data structure is the right move.
Where Ninja Tables fit well
Ninja Tables is a data table plugin built for interactive, filterable, searchable tables connected to real data sources. It handles WooCommerce product tables, Google Sheets integration, form-connected tables, and manual data entry with full interactivity.
A three-row pricing comparison that never changes, a portfolio grid where images drive the experience, or a purely presentational layout with no user interaction are all better served by simpler tools. Ninja Tables adds the most value when the data is live, the volume is meaningful, and users need to do something with the table rather than just read it.
For high-volume use cases specifically, the DataTables rendering engine introduced in version 5.2.8 handles the scale that standard WordPress table plugins cannot. If your dataset is heading into the tens of thousands of rows, that is where Ninja Tables now operates differently from the alternatives. For the use cases, it fits at standard data scale, the types of product tables your business needs, and the examples of data table design on websites show what well-matched implementations look like in practice.
Wrapping up
The table plugin you choose matters less than whether a table is the right structure for your data in the first place. A well-chosen plugin on a structurally wrong table still produces a table that frustrates users. A capable plugin mismatched to the wrong table type creates configuration problems that no setting resolves.
When those foundational questions are answered correctly, the plugin decision becomes much more straightforward.
Data that belongs in a table is structured, comparable across rows, high enough in volume to justify the format, and meant to be interacted with rather than passively read. When the data does not fit those conditions, starting with a different format saves time that would otherwise be spent troubleshooting a tool that was never suited to the job.
FAQs
Can I use a table to display WordPress posts or custom post types?
Yes, with the right plugin. The Posts Table pulls directly from your WordPress database and displays posts as rows, complete with filtering by category, tag, date, or custom field. Ninja Tables supports this through its WP Posts integration. The key question is whether users actually need to compare posts across attributes, or whether they just need a list. If it is the latter, a standard archive template may serve better.
What is the difference between a data table and a display table in WordPress?
A display table holds static content entered manually, formatted for readers who scan it once. A data table connects to a live data source and supports user interaction: search, filter, sort, and pagination. Most WordPress table plugins lean toward one or the other. Using the wrong type for your use case creates problems that plugin settings cannot fix.
My table loads slowly. Is it always a plugin problem?
Not always. If the table has fewer than 500 rows and still loads slowly, the issue is likely the plugin’s rendering or a page-level performance problem. If it has several thousand rows, the issue is almost certainly client-side processing. The plugin is loading all rows into the browser at once, and the browser cannot handle it. The fix is a plugin that uses server-side processing, not a faster version of the same architecture.
When should I use a chart instead of a table?
Use a chart when the pattern or trend in the data is more important than the individual values. Use a table when users need the actual numbers to make a decision or comparison. A chart showing revenue growth over 12 months is more readable than a table. A table showing each month’s exact revenue by product line is more useful than a chart when a user needs to check a specific figure.
How do I know if my data is too complex for a standard table?
Two signals. First: if every cell requires a tooltip or footnote to be understood, the data has too much context for a flat table format. Second: if rows represent genuinely different types of things rather than the same type of thing with different values, the table structure is forcing a comparison that does not exist in the data. Both cases call for a different format, or at least a restructured table that separates the data into more coherent groups.
Ninja Tables– Easiest Table Plugin in WordPress


Add your first comment to this post