
Building Live Reporting Dashboards from Google Sheets in WordPress

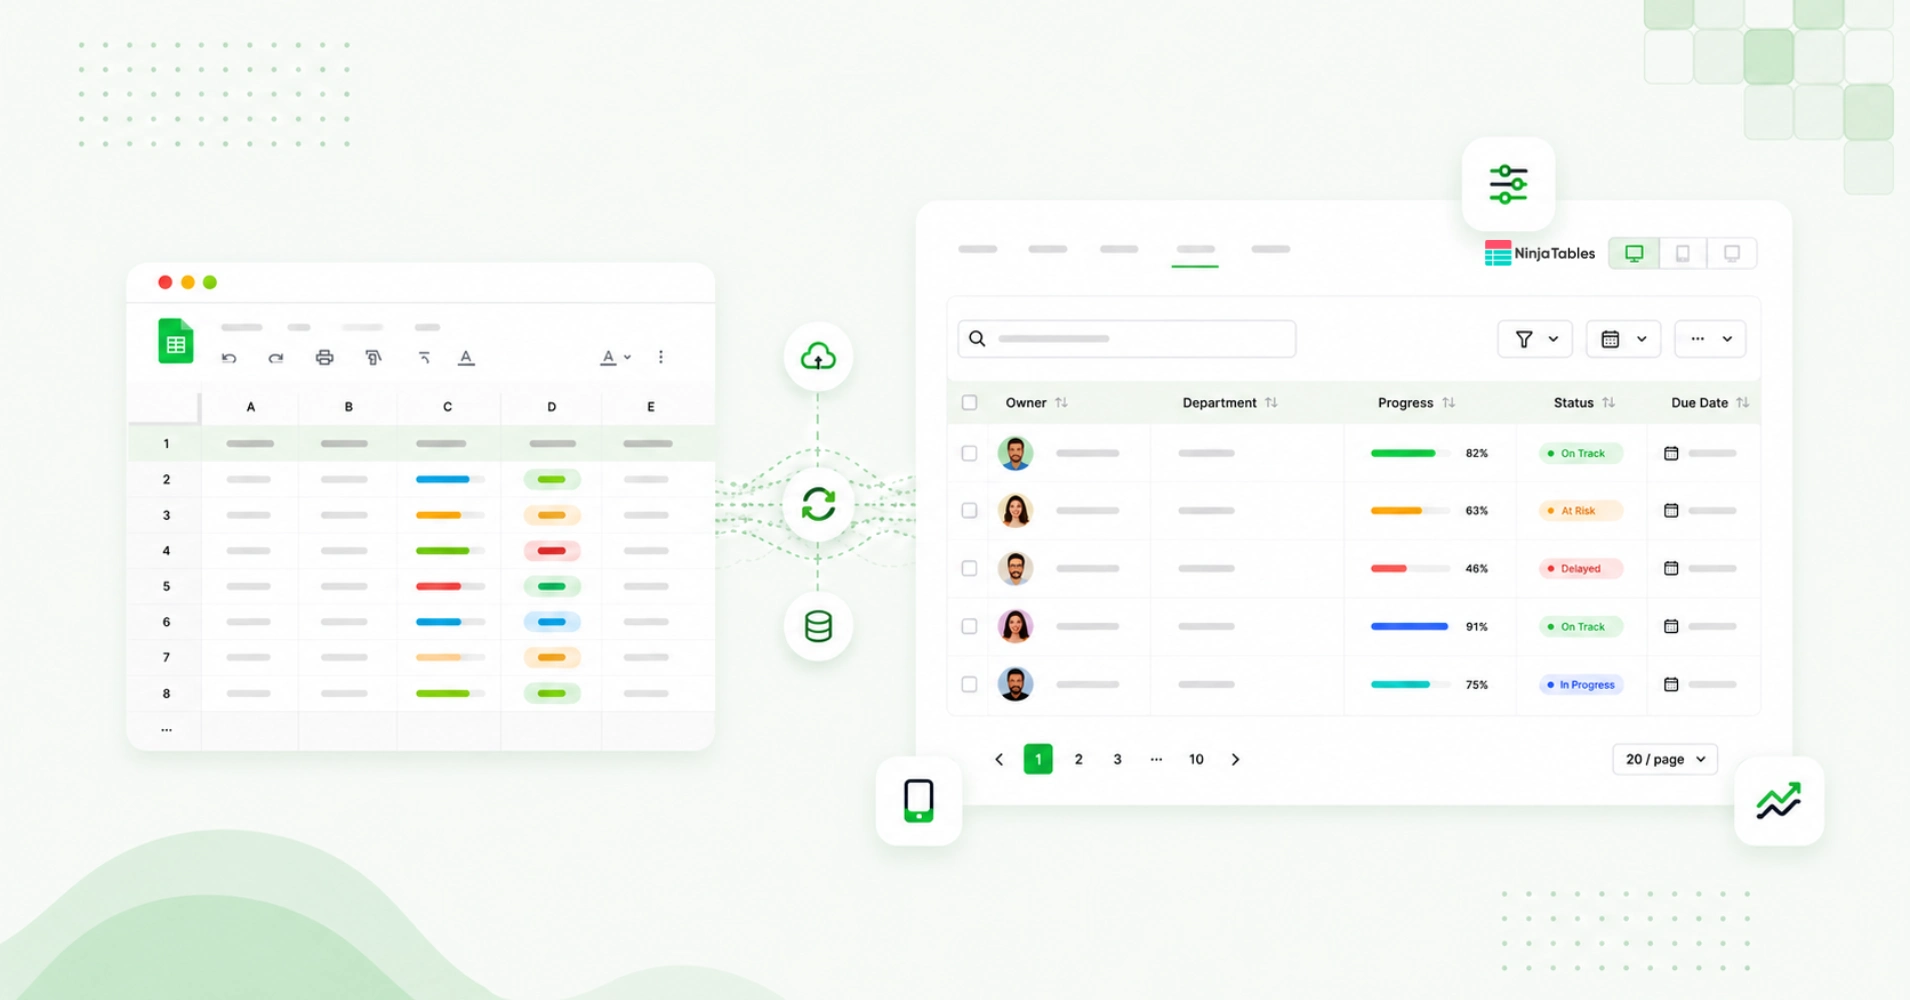
Your data already lives in Google Sheets. The problem is turning it into something people can actually use. A spreadsheet is built for editing, not reporting. Sharing raw links exposes the data, embedding a sheet creates a clunky experience, and manually rebuilding reports in WordPress means they’re outdated almost as soon as you publish them.
A live reporting dashboard solves that problem. By connecting Google Sheets to WordPress, you can display automatically updated data in a searchable, filterable table that visitors can actually interact with. This guide shows you how to build one using Ninja Tables.
Key Takeaways
- A raw Google Sheets iframe embed is not a reporting dashboard – it is a spreadsheet in a frame, with all the visual noise that comes with it
- Ninja Tables connects to a published Google Sheet and presents the data as a structured, filterable table on your WordPress site
- The connection syncs every five minutes automatically, so the dashboard reflects current data without any manual action
- Dashboard quality depends on how the Google Sheet is structured before the connection is made
- Conditional formatting, column types, and filter controls in Ninja Tables turn raw rows into a presentation layer stakeholders can actually use
What a Live Reporting Dashboard Actually Needs
A reporting dashboard does one job: it takes data that changes over time and presents it in a form where the right people can see what they need without digging. That means readable column structure, filtering that narrows to relevant records, and a display that updates when the underlying data does.
Most WordPress site owners try to solve this with a Google Sheets embed. The iframe drops a live sheet onto the page, which technically updates in real time. The problem is that it looks and behaves exactly like a Google Sheet: column letters visible, row numbers on the left, formula bars on mobile, no filtering, no responsive behavior, and no alignment with the site’s design. It is a spreadsheet frame, not a dashboard.
A real dashboard on WordPress requires a structured presentation layer that sits between the data and the viewer. That is what Ninja Tables provides when connected to a live Google Sheet.
| Company | Country | Employees | DUNS number | Profit | |
|---|---|---|---|---|---|
| Alva Co. | Sweden | [email protected] | 90 | 73-062-6234 | 40% |
| Adeleid | Canada | [email protected] | 52 | 43-759-9867 | 64.9% |
| Fizzy Group of Industries | Ukraine | [email protected] | 91 | 19-274-2334 | 35% |
| Lukoil Company | Russia | [email protected] | 27 | 68-529-1315 | 8% |
| Matsubishi | Japan | [email protected] | 27 | 68-529-1363 | 18% |
| Denesik Engil Constructions | Portugal | [email protected] | 45 | 14-374-1386 | 3% |
| SM Entertainment | S. Korea | [email protected] | 58 | 84-413-1810 | 26.3% |
| IKAA | Sweden | [email protected] | 71 | 44-573-6505 | 9% |
| Ayila Corp. | Philippines | [email protected] | 80 | 05-065-5384 | 62.7% |
Why Google Sheets Embeds Fail as Reporting Dashboards
When you embed a Google Sheet directly, the viewer gets the full spreadsheet interface. There is no way to hide internal calculation columns, limit visible rows to a specific status, or let viewers filter by a team or date range without giving them edit access. The sheet either shows everything or nothing.
Formatting is another problem. Google Sheets uses cell-level styling that does not transfer to a WordPress page. A color-coded status column means nothing to someone reading an iframe where the colors render inconsistently across devices. The embed does not inherit your site’s typography or spacing.
For internal use, a shared Google Sheet link is fine. For presenting data to clients, stakeholders, or the public through a WordPress site, the embed approach produces a result that reflects the tool used to store the data rather than the professionalism of the data itself.
Connecting Google Sheets to Ninja Tables
Ninja Tables connects to Google Sheets by reading a published CSV link from the sheet. This approach does not require API credentials or OAuth setup – it works through Google’s built-in web publishing feature.
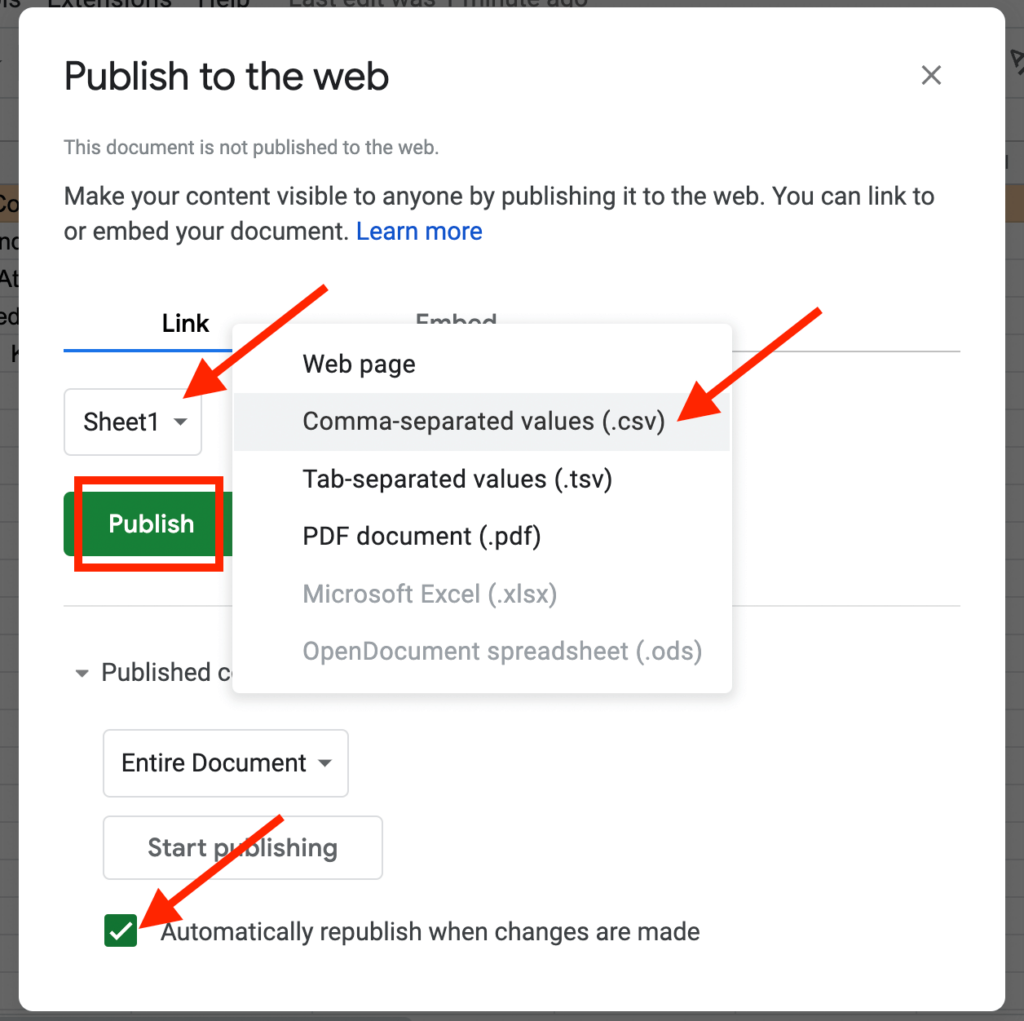
- In your Google Sheet, go to File > Share > Publish to web
- Select the specific sheet tab you want to connect.
- Choose Comma-separated values (.csv) as the format.
- Check Automatically republish when changes are made, then click Publish and copy the link.
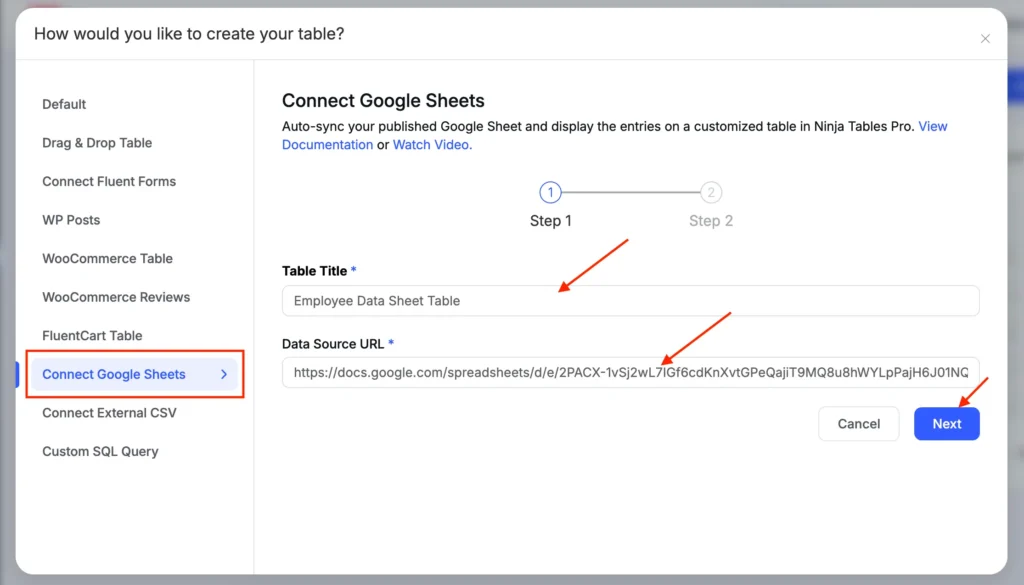
In WordPress, go to Ninja Tables > Add New Table and choose Google Sheets as the data source type. Paste the CSV URL into the data source field, proceed through the column selection step, and save the table.
Ninja Tables checks the source URL at 5-minute intervals and updates the table data when changes are detected. Any row added, edited, or removed in the Google Sheet appears in the WordPress dashboard within 5 minutes, with no action required on your end.
For a detailed walkthrough of the connection process, the Google Sheets integration guide covers each step with screenshots of the current plugin interface.
Customize Your Dashboard in Ninja Tables
Once the data is in, the configuration work is where raw imported rows become a proper reporting display. Several settings are specific to a dashboard context.
| Full Name | Course Selected | Department | Preferred Class Time | Enrollment Status | GPA | Comments | |
|---|---|---|---|---|---|---|---|
| Alice Morgan | [email protected] | CS101 | Computer Science | Morning | Confirmed | 3.9 | Needs front row seat |
| Ben Carter | [email protected] | MTH201 | Mathematics | Evening | Waitlisted | 3.2 | Prefers online option |
| Chloe Zhang | [email protected] | BIO210 | Biology | Morning | Confirmed | 4 | Vegan meal option |
| Daniel Roy | [email protected] | CS101 | Computer Science | Afternoon | Confirmed | 2.8 | Needs accommodation |
| Eva Singh | [email protected] | ENG101 | Humanities | Morning | Confirmed | 3.5 | None |
| Felix Jones | [email protected] | MTH201 | Mathematics | Evening | Cancelled | 2.1 | Retaking from last semester |
| Grace Lin | [email protected] | BIO210 | Biology | Morning | Confirmed | 3.8 | Allergic to chalk dust |
| Henry Owens | [email protected] | CS101 | Computer Science | Evening | Confirmed | 3 | Prefers Mac Lab |
| Irene Wallace | [email protected] | ENG101 | Humanities | Morning | Waitlisted | 3.7 | Visual learning preference |
| Jake Matthews | [email protected] | BIO210 | Biology | Afternoon | Confirmed | 2.9 | Needs lab assistant |
Column types and display
After import, Ninja Tables auto-detects column types. Review each column and set the type accurately. A date column set to text type will sort alphabetically instead of chronologically. A URL column set to text type will display a raw string instead of a clickable link. Set status or category columns to a fixed-option type if you want filter dropdowns rather than free text search.
Search and filters
Enable the global search bar for tables where viewers may want to find a specific record by name or keyword. Enable column-level filters on the columns viewers are most likely to use for narrowing the data: project status, assigned team, date range, or category. For each filter-enabled column, set the filter type – select dropdown works well for columns with a fixed set of values; range input works well for numerical and date columns.
The searchable and sortable table setup guide covers filter configuration options in detail.
Conditional formatting
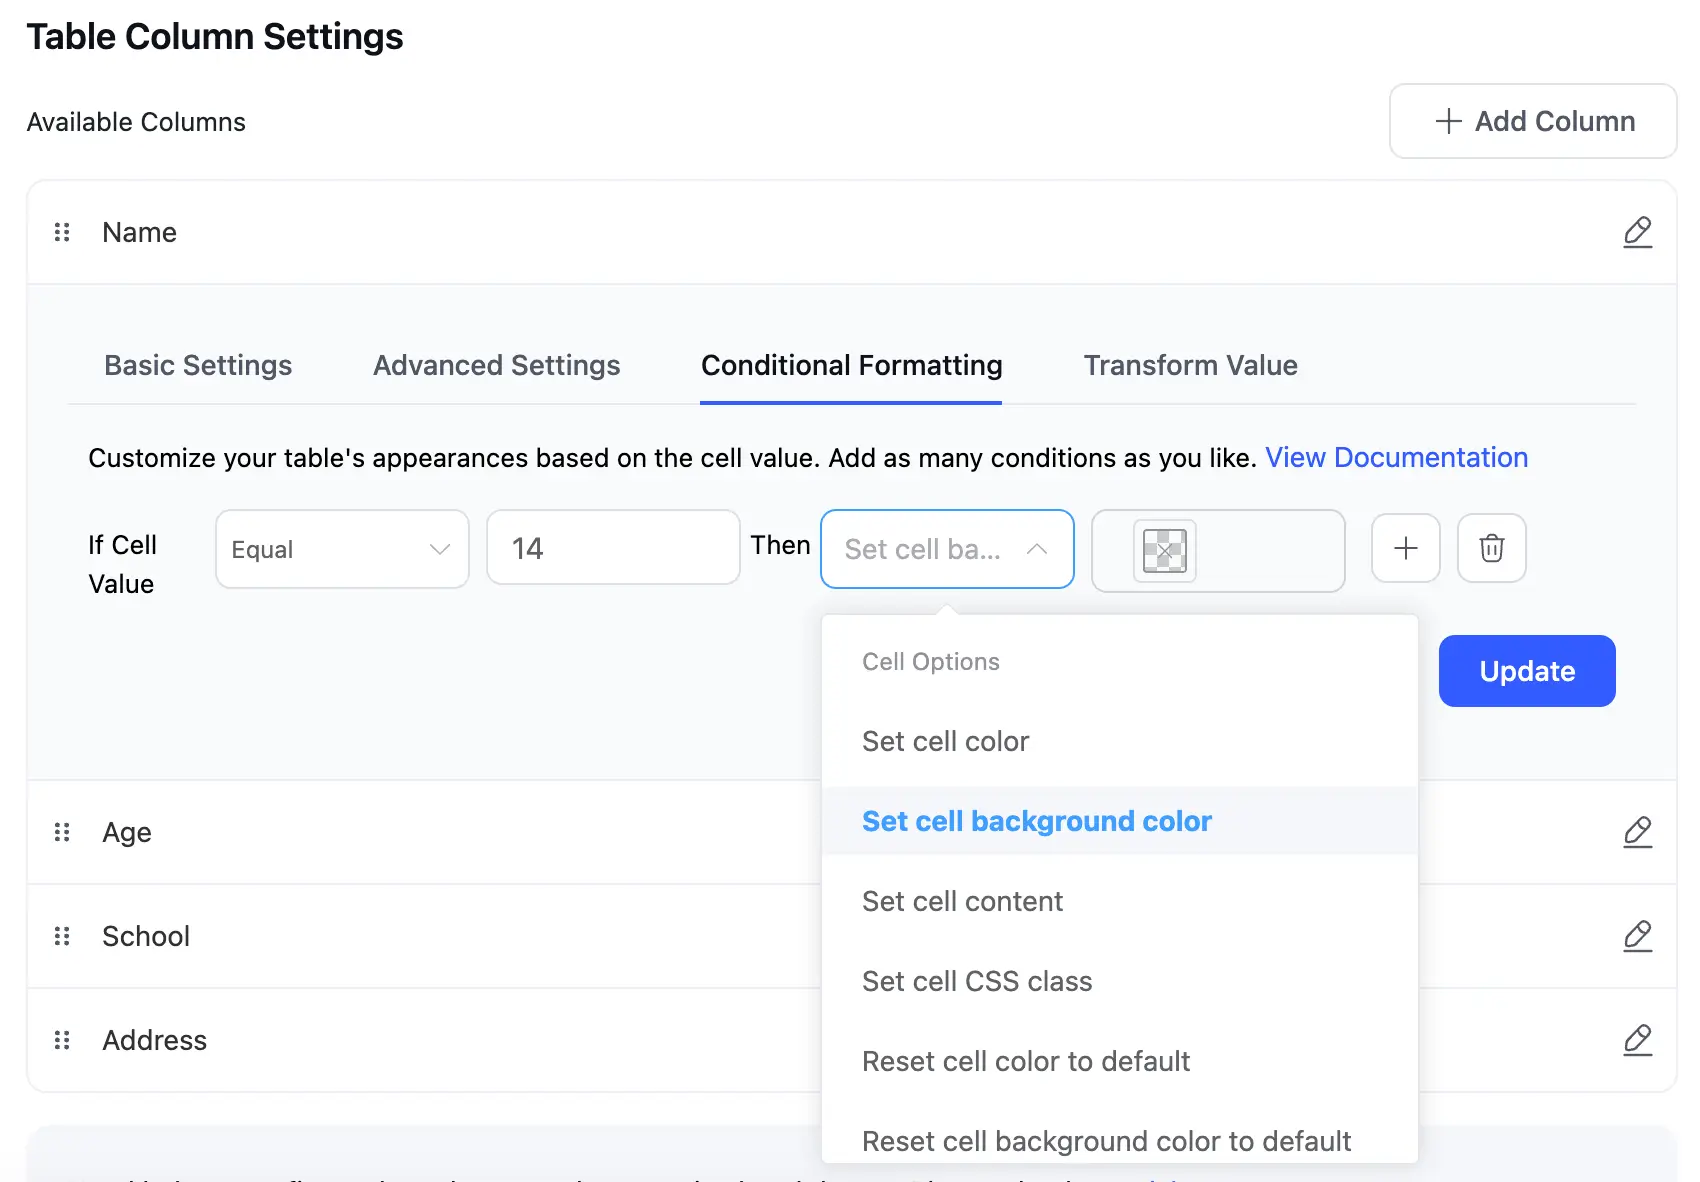
For status columns, conditional formatting makes the dashboard readable without requiring viewers to read every cell. Set a background color rule on the status column so rows with “Overdue” appear in a distinct color from rows marked “On Track” or “Complete.” This turns a column of text values into a visual scanning layer.
To configure conditional formatting, open the column settings for the relevant column and add value-based formatting rules. Each rule applies a background color, text color, or both when the cell value matches a specified condition.
Pagination and density
For dashboards with many records, set pagination to a number of rows that fits comfortably on the page without requiring excessive vertical scrolling. For reporting contexts where viewers are scanning rather than reading every row in detail, compact row density shows more records per scroll without losing readability.
Dashboard Use Cases That Work Well With This Setup
This architecture works for any situation where data is maintained in Google Sheets and needs to be presented through a WordPress site in a structured, filterable format.
Sales and revenue reporting: A team updating a monthly sales sheet in Google Sheets can connect it to a client-facing WordPress page, giving clients a filtered view of their account activity without sharing the full sheet.
Project status tracking: A project management sheet with tasks, owners, deadlines, and status columns becomes a searchable project tracker on a team portal, updated as the sheet changes.
| Client Name | Contact Info | Project History | Payment Terms | Time Zone | Contract Status | Deadline | Notes |
|---|
Booking item lists: Booking submissions collected via Google Forms in Google Sheets appear in a sorted, searchable table on the restaurant page, allowing visitors to get information at a glance.






Inventory and stock displays: Product inventory maintained in Sheets appears as a filterable catalog on a supplier or internal portal page, reflecting current stock without manual page updates.
| Item ID | Item Name | Category | Supplier | Quantity in Stock | Last Restocked | Notes |
|---|---|---|---|---|---|---|
| 1001 | Blue T-Shirt | Apparel | ABC Clothing | 50 | 2025-05-10 | Best Seller |
| 1002 | Wireless Mouse | Electronics | XYZ Gadgets | 15 | 2025-05-09 | Low Stock |
| 1003 | Notebook | Stationery | PaperWorks Co. | 200 | 2025-05-01 | Bulk item |
| 1004 | Coffee Mug | Kitchenware | Mug Depot | 30 | 2025-04-30 | Gift-worthy |
| 1005 | Desk Lamp | Electronics | LightHouse Ltd. | 8 | 2025-05-05 | Trending item |
| 1006 | Water Bottle | Fitness | AquaGear | 60 | 2025-05-08 | Sustainable item |
| 1007 | Canvas Backpack | Apparel | BagItUp | 12 | 2025-05-06 | Limited edition |
Public data and open records: Organizations publishing structured public data can maintain it in Sheets for easy internal editing and display the current version through a WordPress page as a filterable reference table.
What Stays Live and What Needs Your Attention
The Ninja Tables and Google Sheets connection handles data updates automatically, but a few things require deliberate management.
The five-minute sync interval means the dashboard is near-live, not real-time. For data where even a few minutes of lag is a problem, a direct database connection or a more immediate data pipeline is the right architecture. For reporting data updated daily or weekly, a five-minute sync is more than sufficient.
Column structure changes in the Google Sheet are not automatically reflected in the Ninja Tables configuration. If you add a new column to the sheet, you need to go into the table settings and add that column to the display. Removing a column from the sheet that is configured in the table will produce an empty column until the table configuration is updated.
If the Google Sheet is unpublished, the published URL is changed, or the sharing permissions are altered, the table will stop updating. This is worth documenting for any sheet maintained by someone other than the person who set up the Ninja Tables connection.
Conclusion
A reporting dashboard is only useful if people can trust that it’s current. When your data lives in Google Sheets and updates automatically on your WordPress site, there’s no need to resend spreadsheets, rebuild tables, or wonder if everyone is looking at the latest version. Maintain your data once, present it everywhere, and let the dashboard do the rest. Whether you’re reporting sales, marketing performance, inventory, or project updates, Ninja Tables helps you publish live data without rebuilding reports every time the spreadsheet changes.

Ninja Tables– Easiest Table Plugin in WordPress

Add your first comment to this post