
Once you install and activate Ninja Charts, this plugin is ready to create any type of chart you want!
As a free WordPress chart plugin, Ninja Charts makes the process of creating online charts very easy.
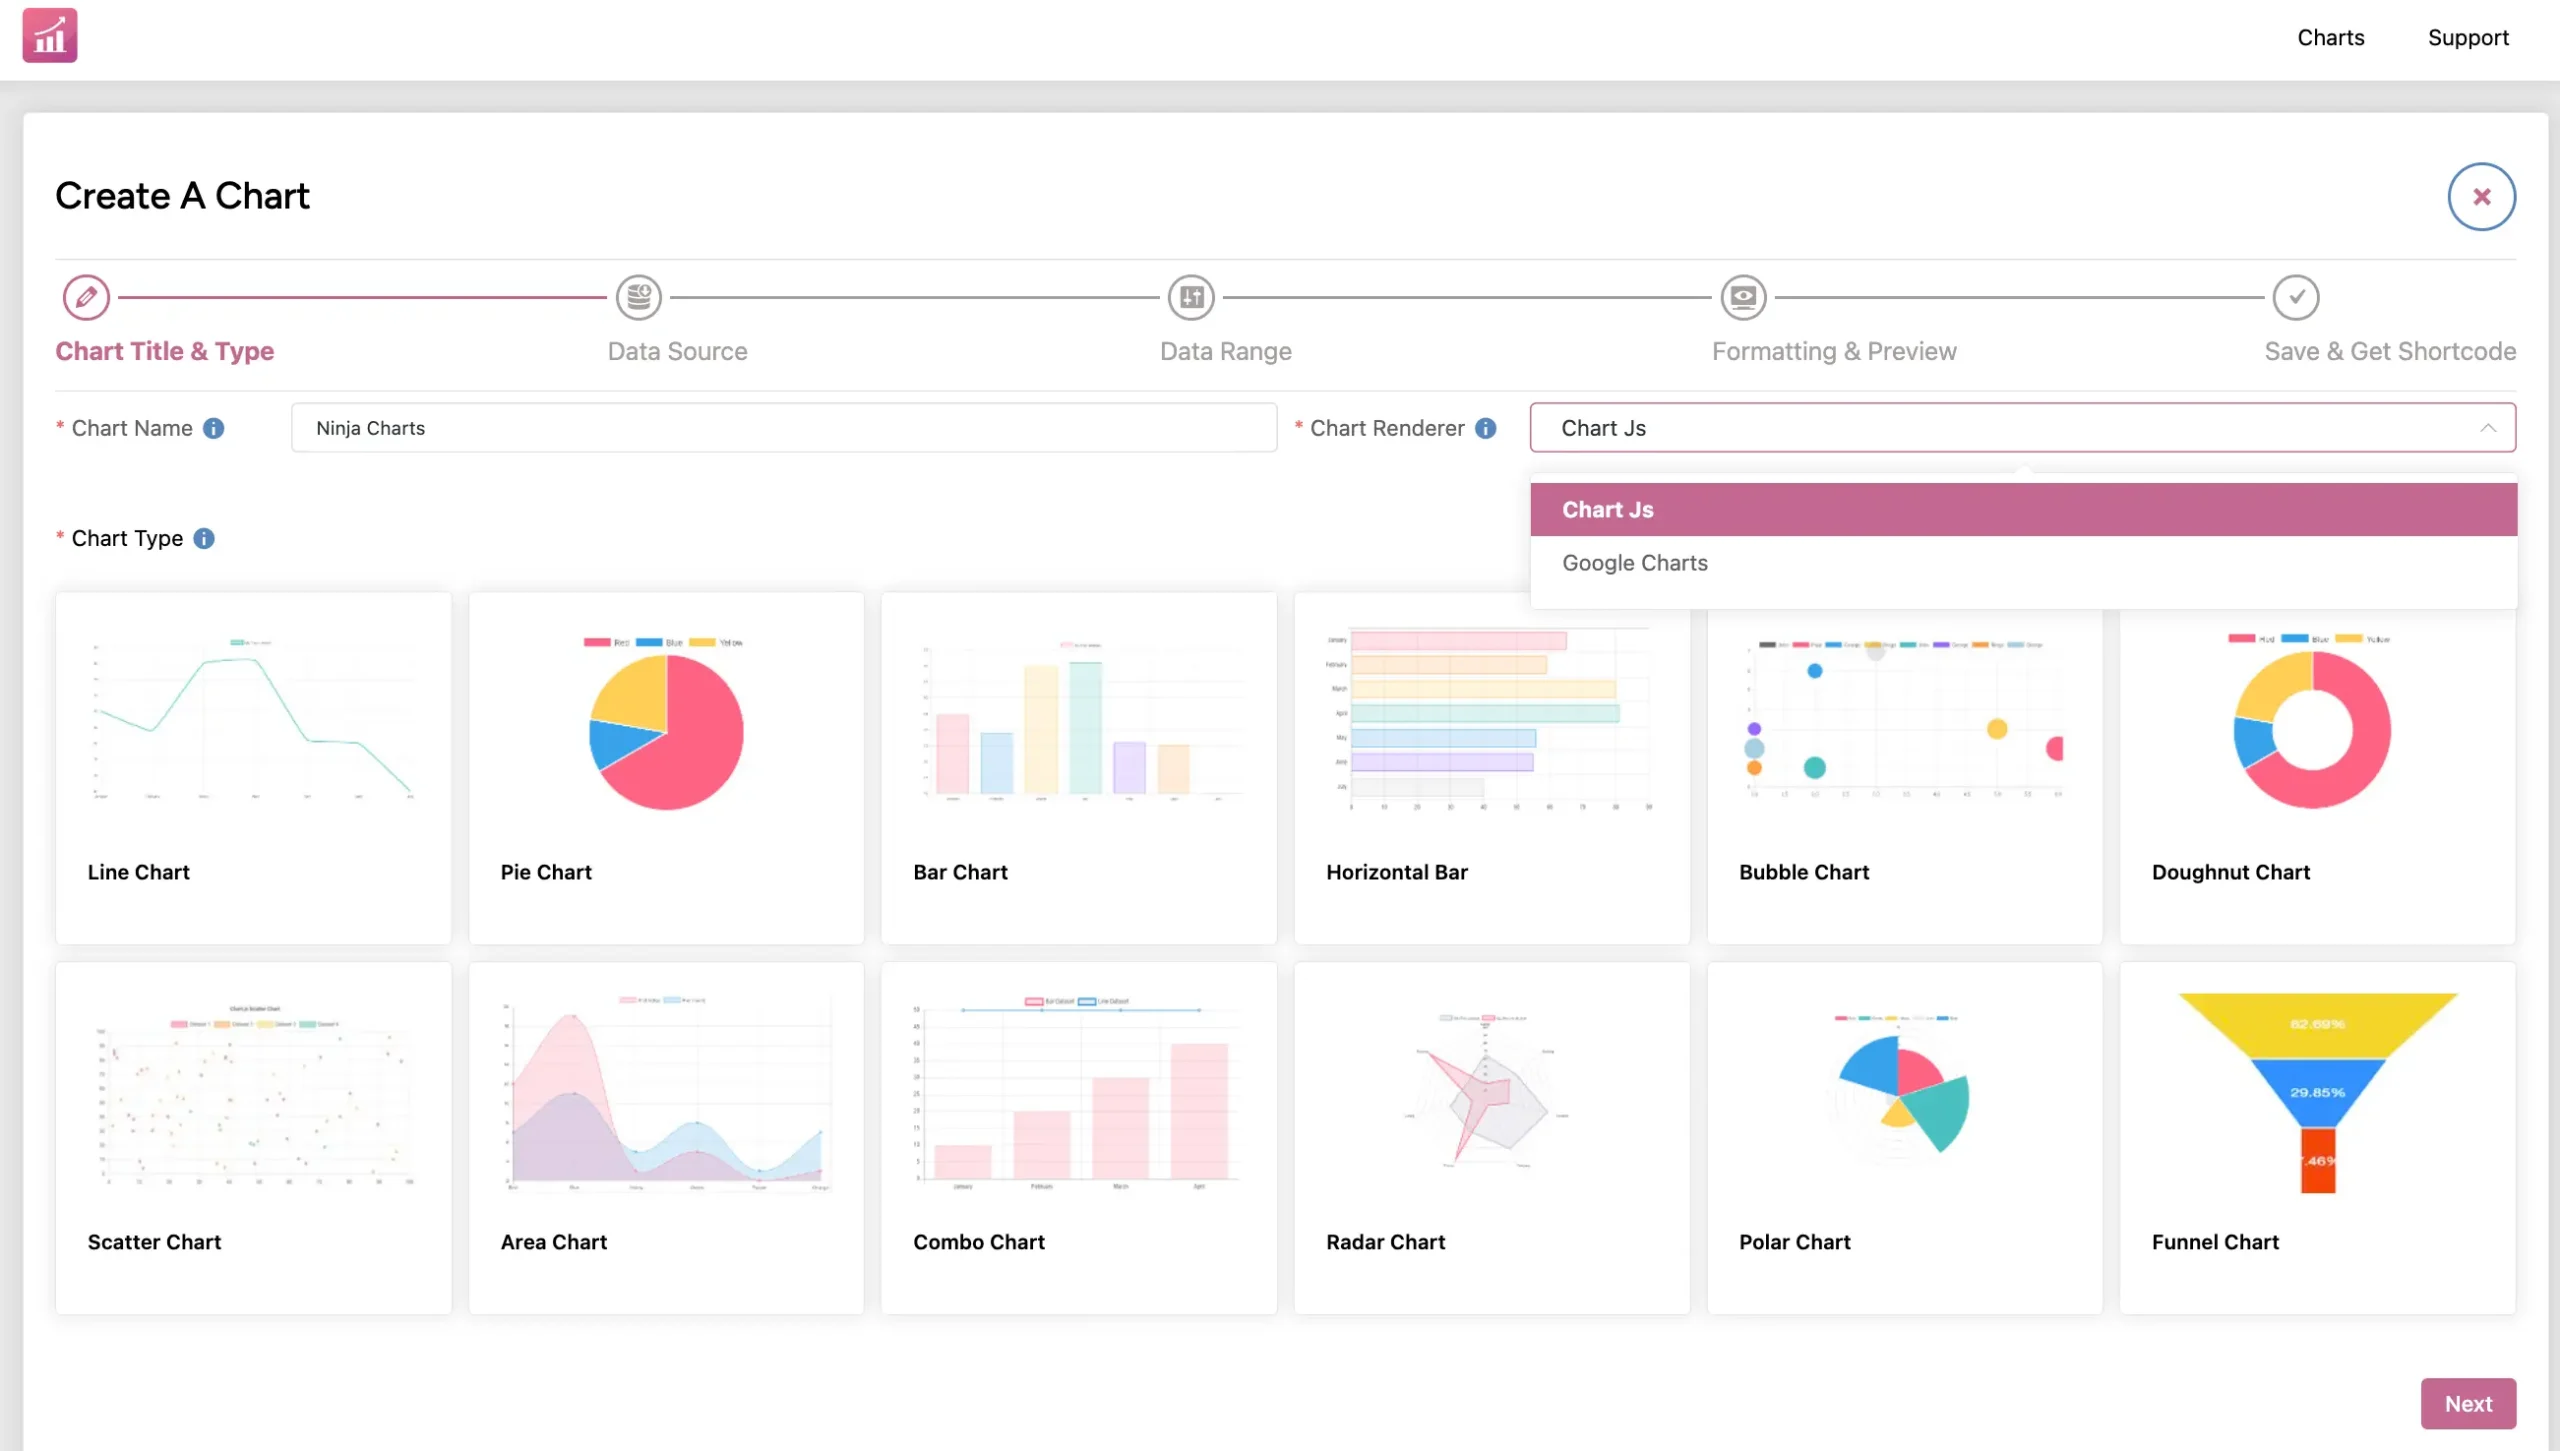
Chart renderer in Ninja Charts:
- Charts Js
- Google Charts
Chart options in Ninja Charts (Charts from both renderers):
- Line Chart
- Pie Chart
- Bar Chart
- Horizontal Bar
- Bubble Chart
- Doughnut Chart
- Scatter Chart
- Area Chart
- Combo Chart
- Radar Chart
- Polar Chart
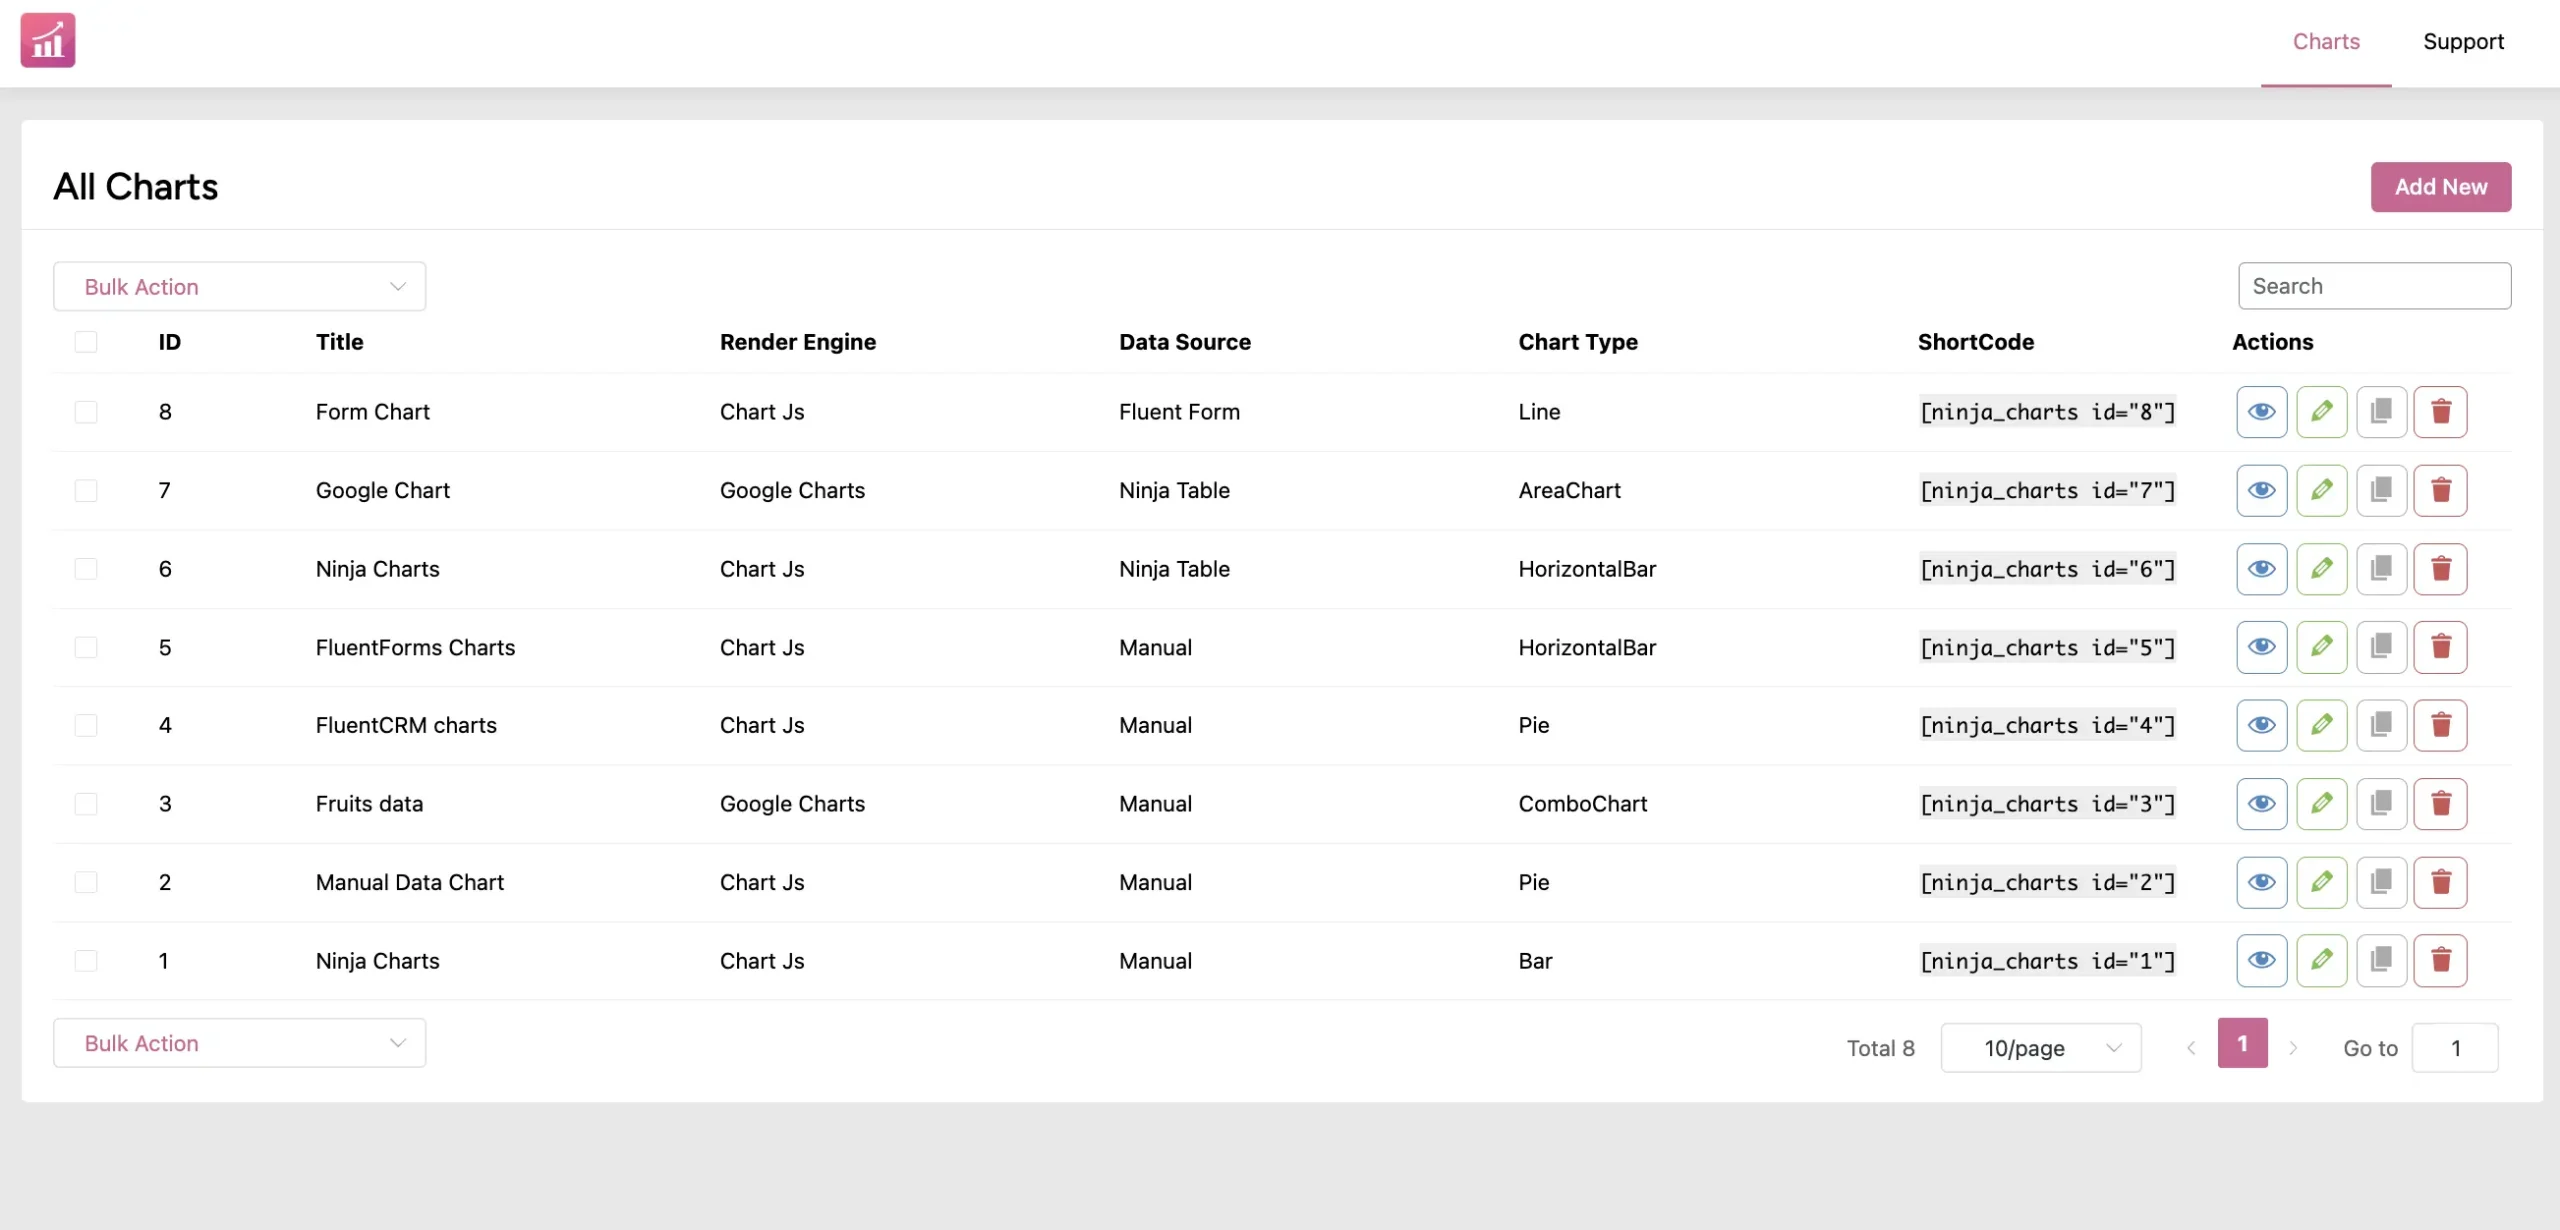
Creating WordPress Charts with Ninja Charts #
First of all, go to the Ninja Charts dashboard and click the “Add New” button.
- Enter the chart name.
- Choose a Chart Renderer. Choose either Google Charts or Chart Js.
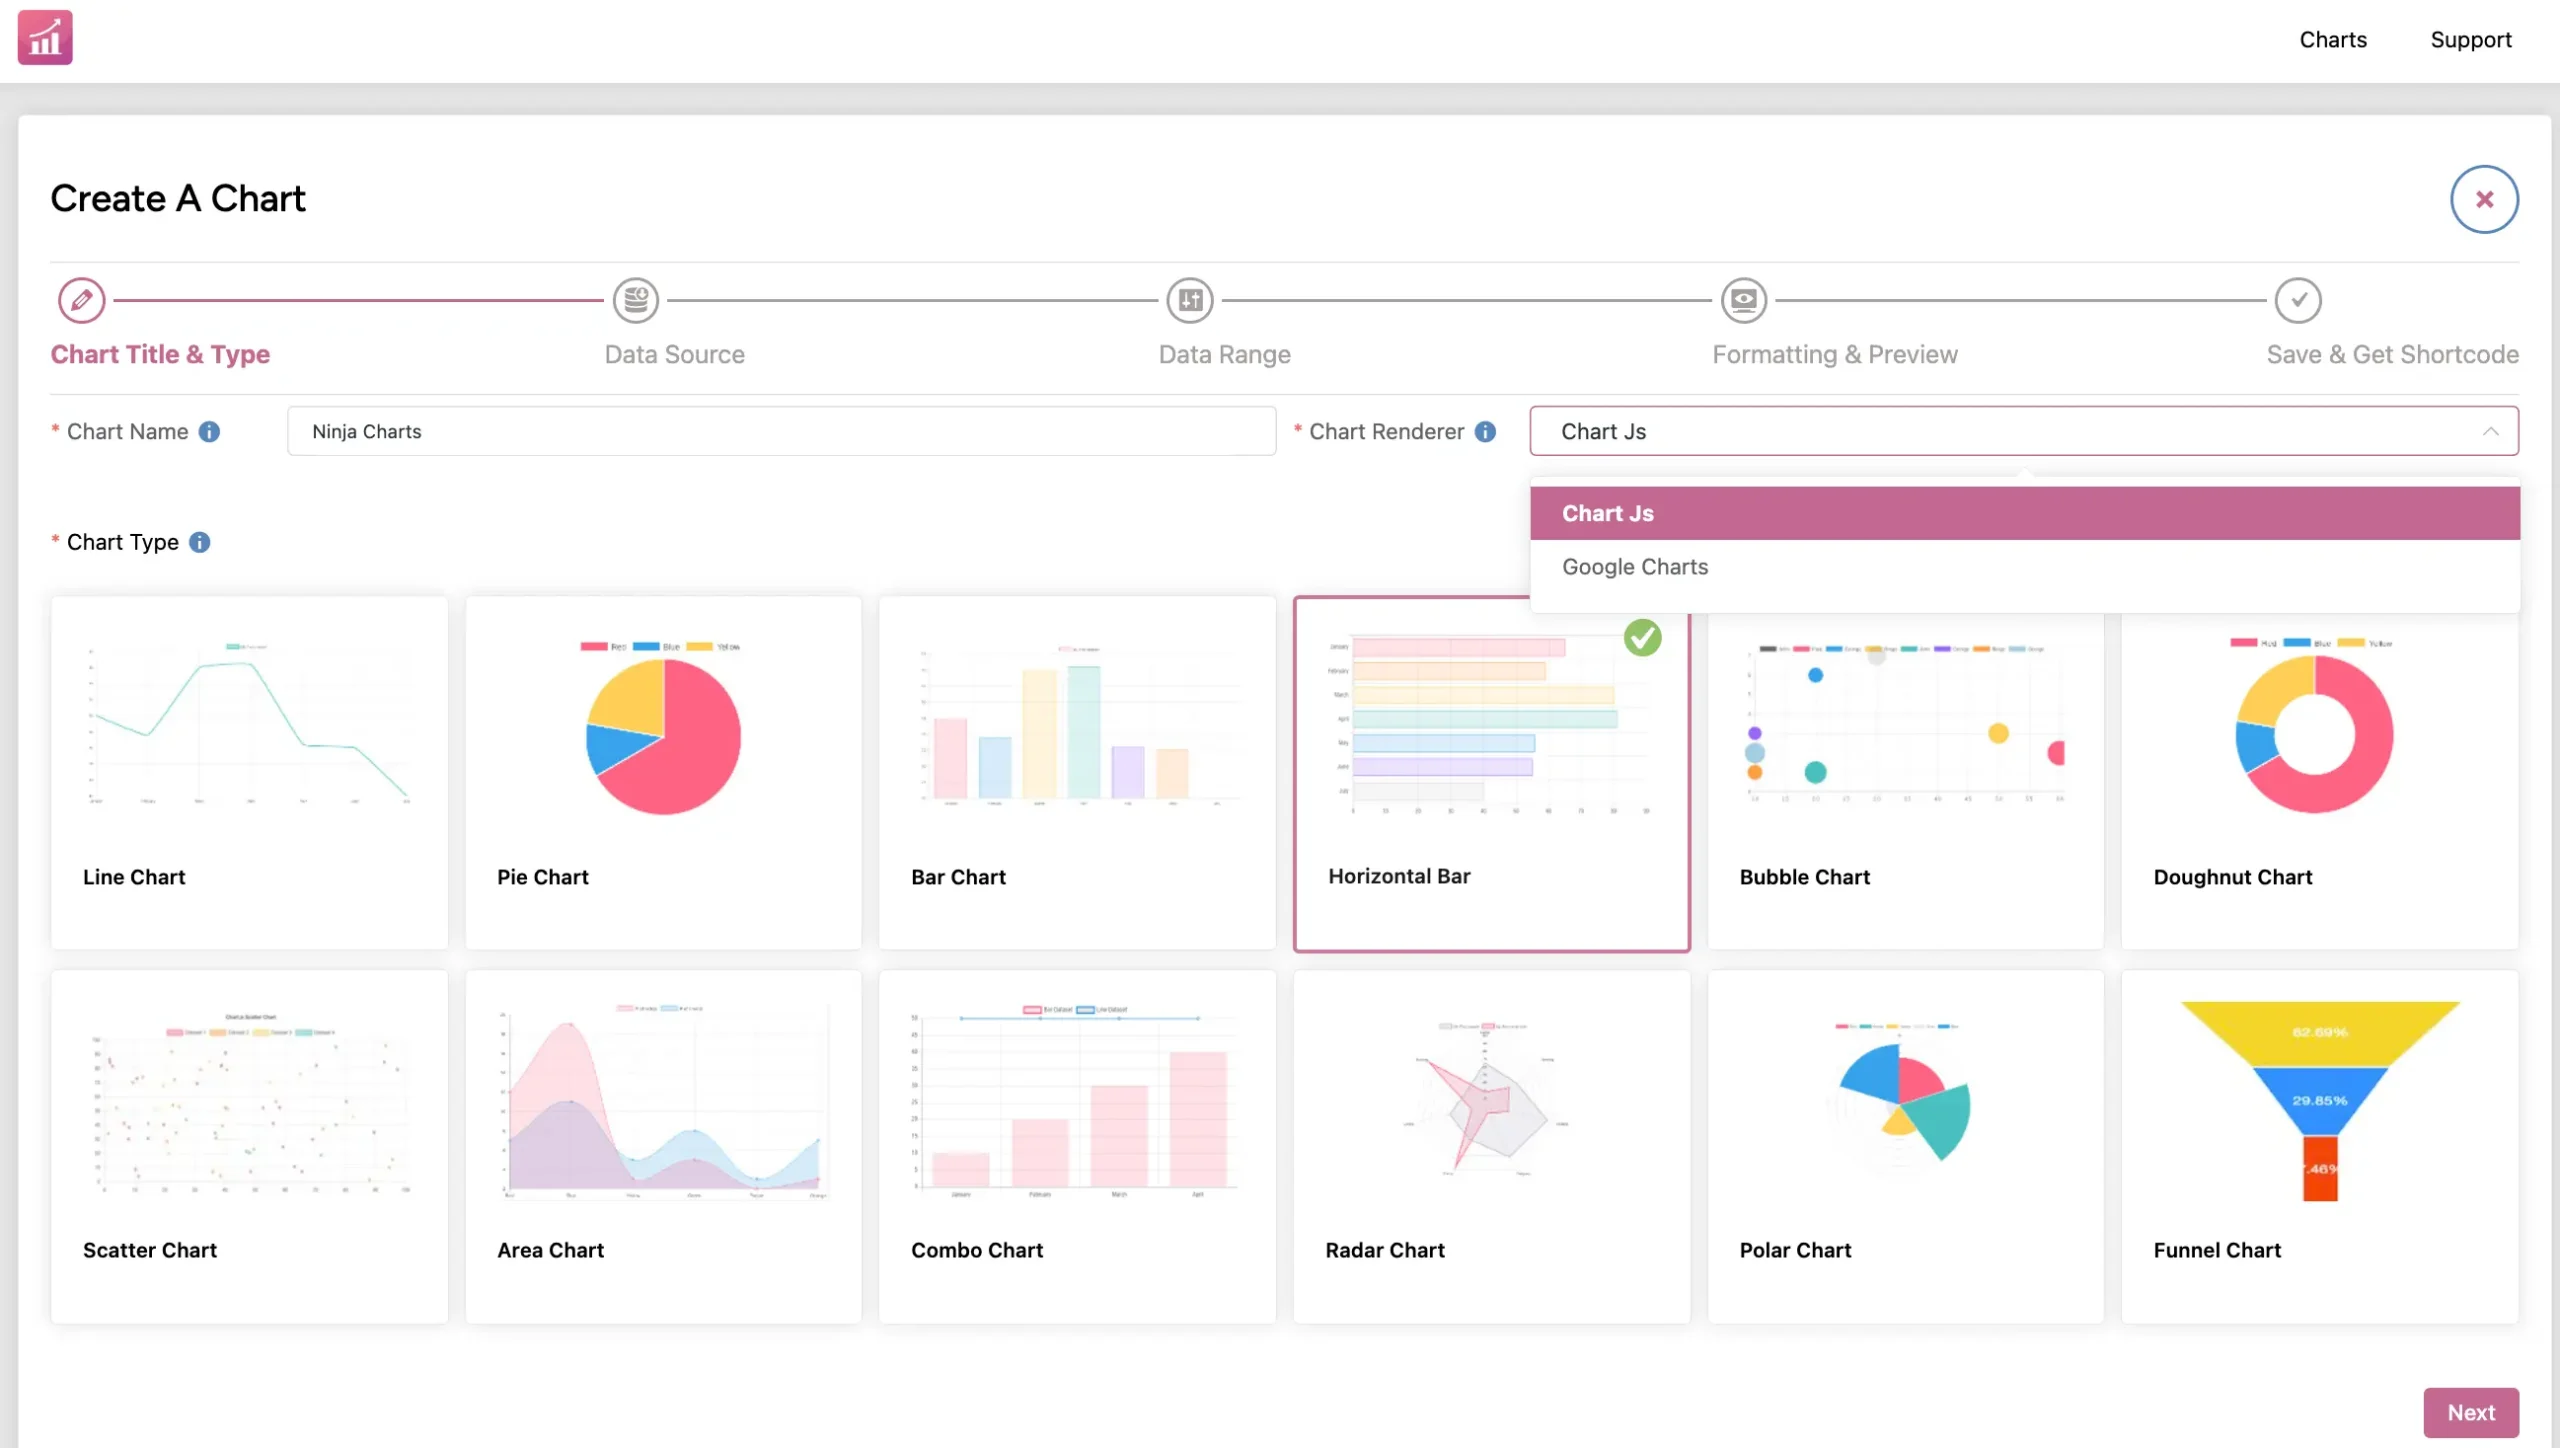
- After choosing Chart Js here, you’ll see multiple chart types. Let’s pick one.
- We’ve selected the Horizontal Bar chart for demonstration and clicked Next.
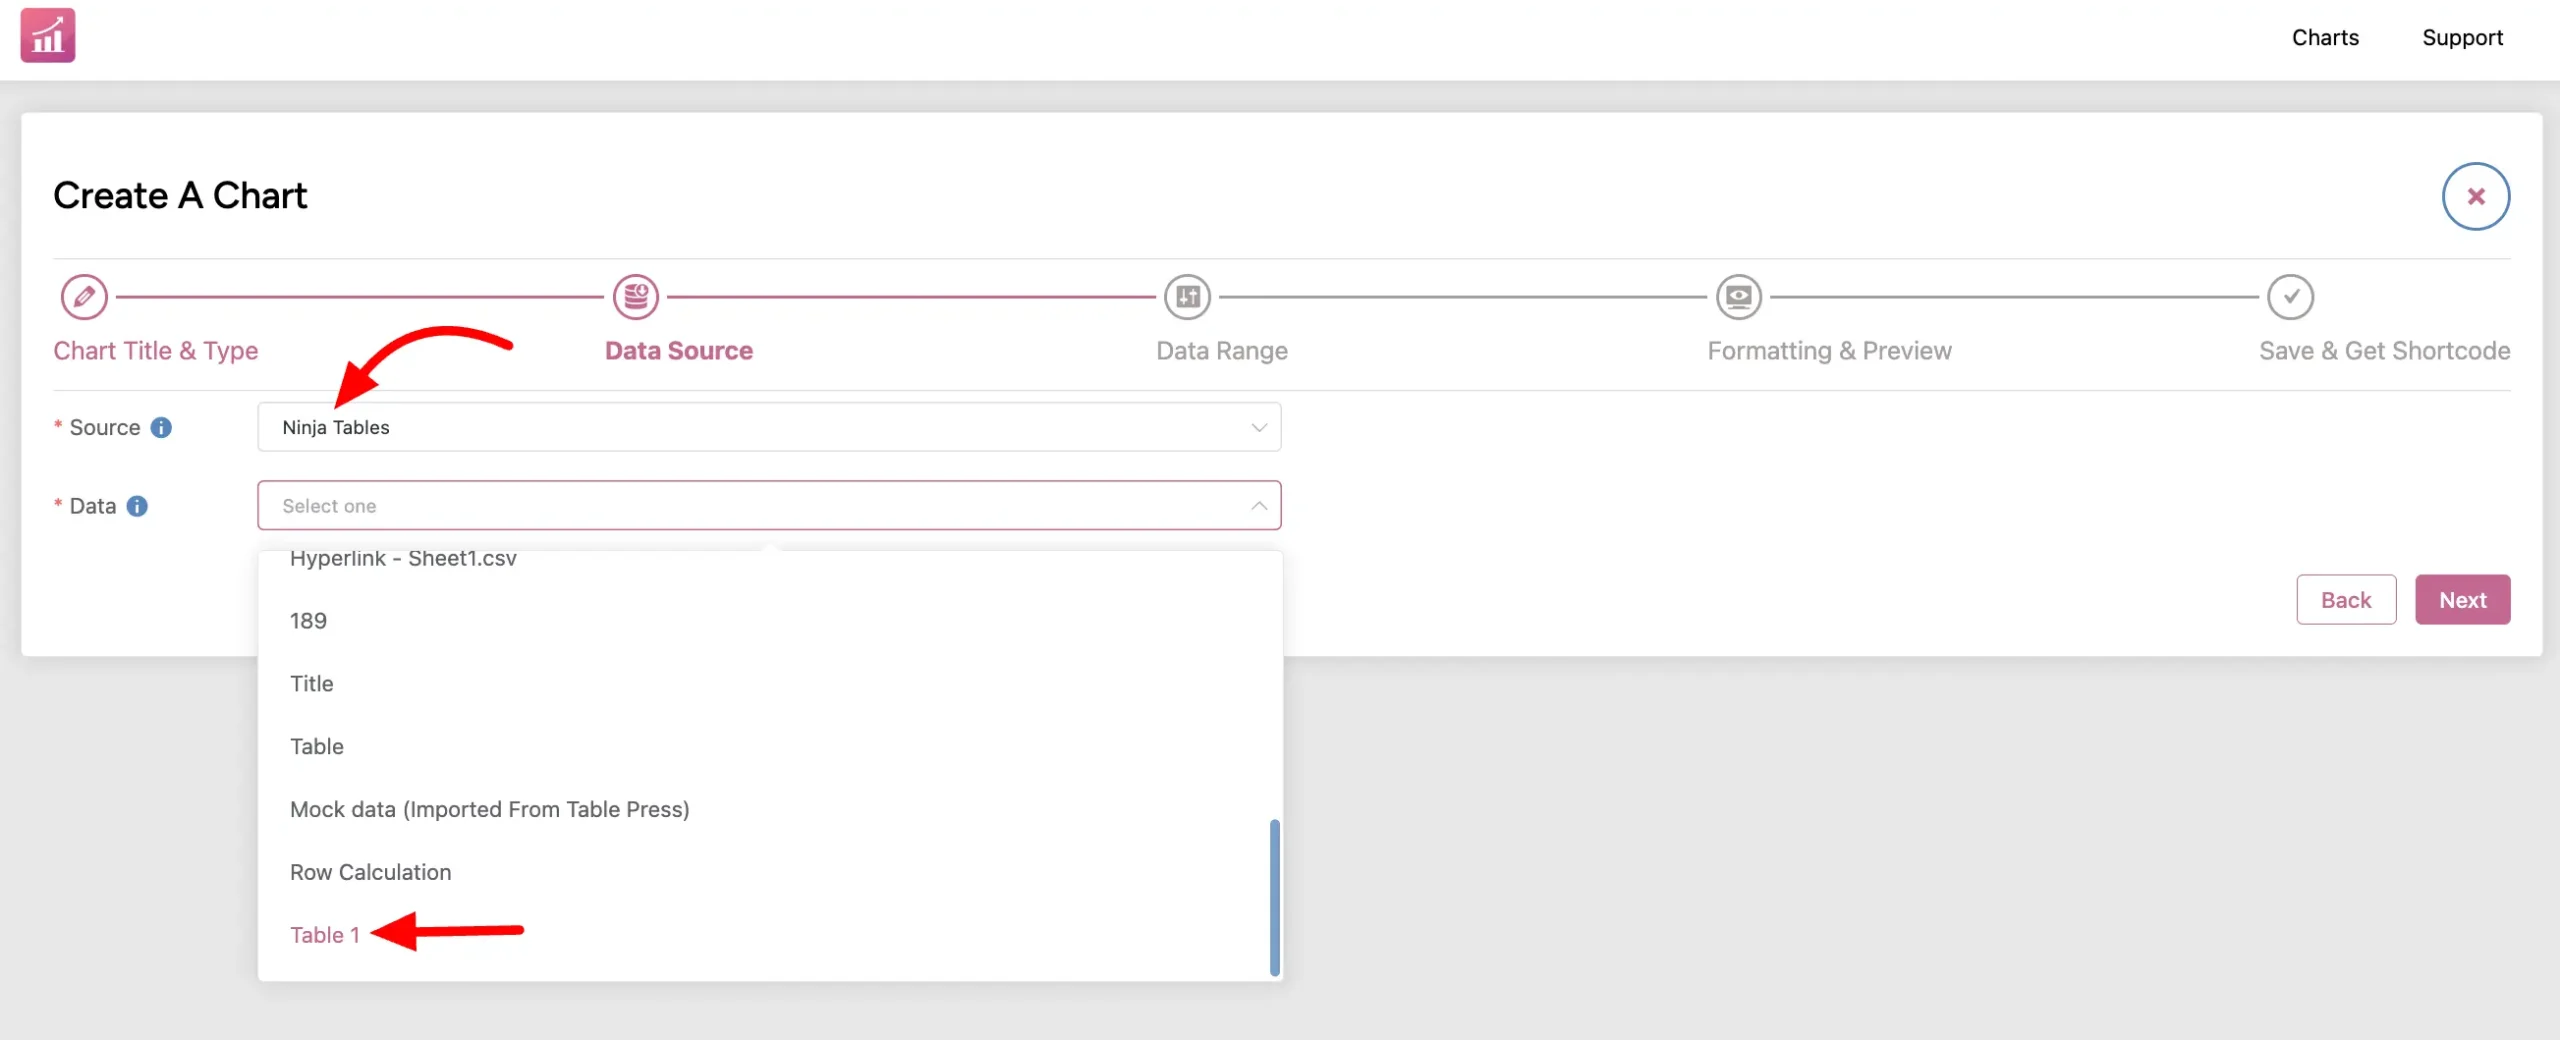
- After this, you have to select the Data Source from the Source option.
-Manual Input
-Ninja Tables
-Fluent Forms
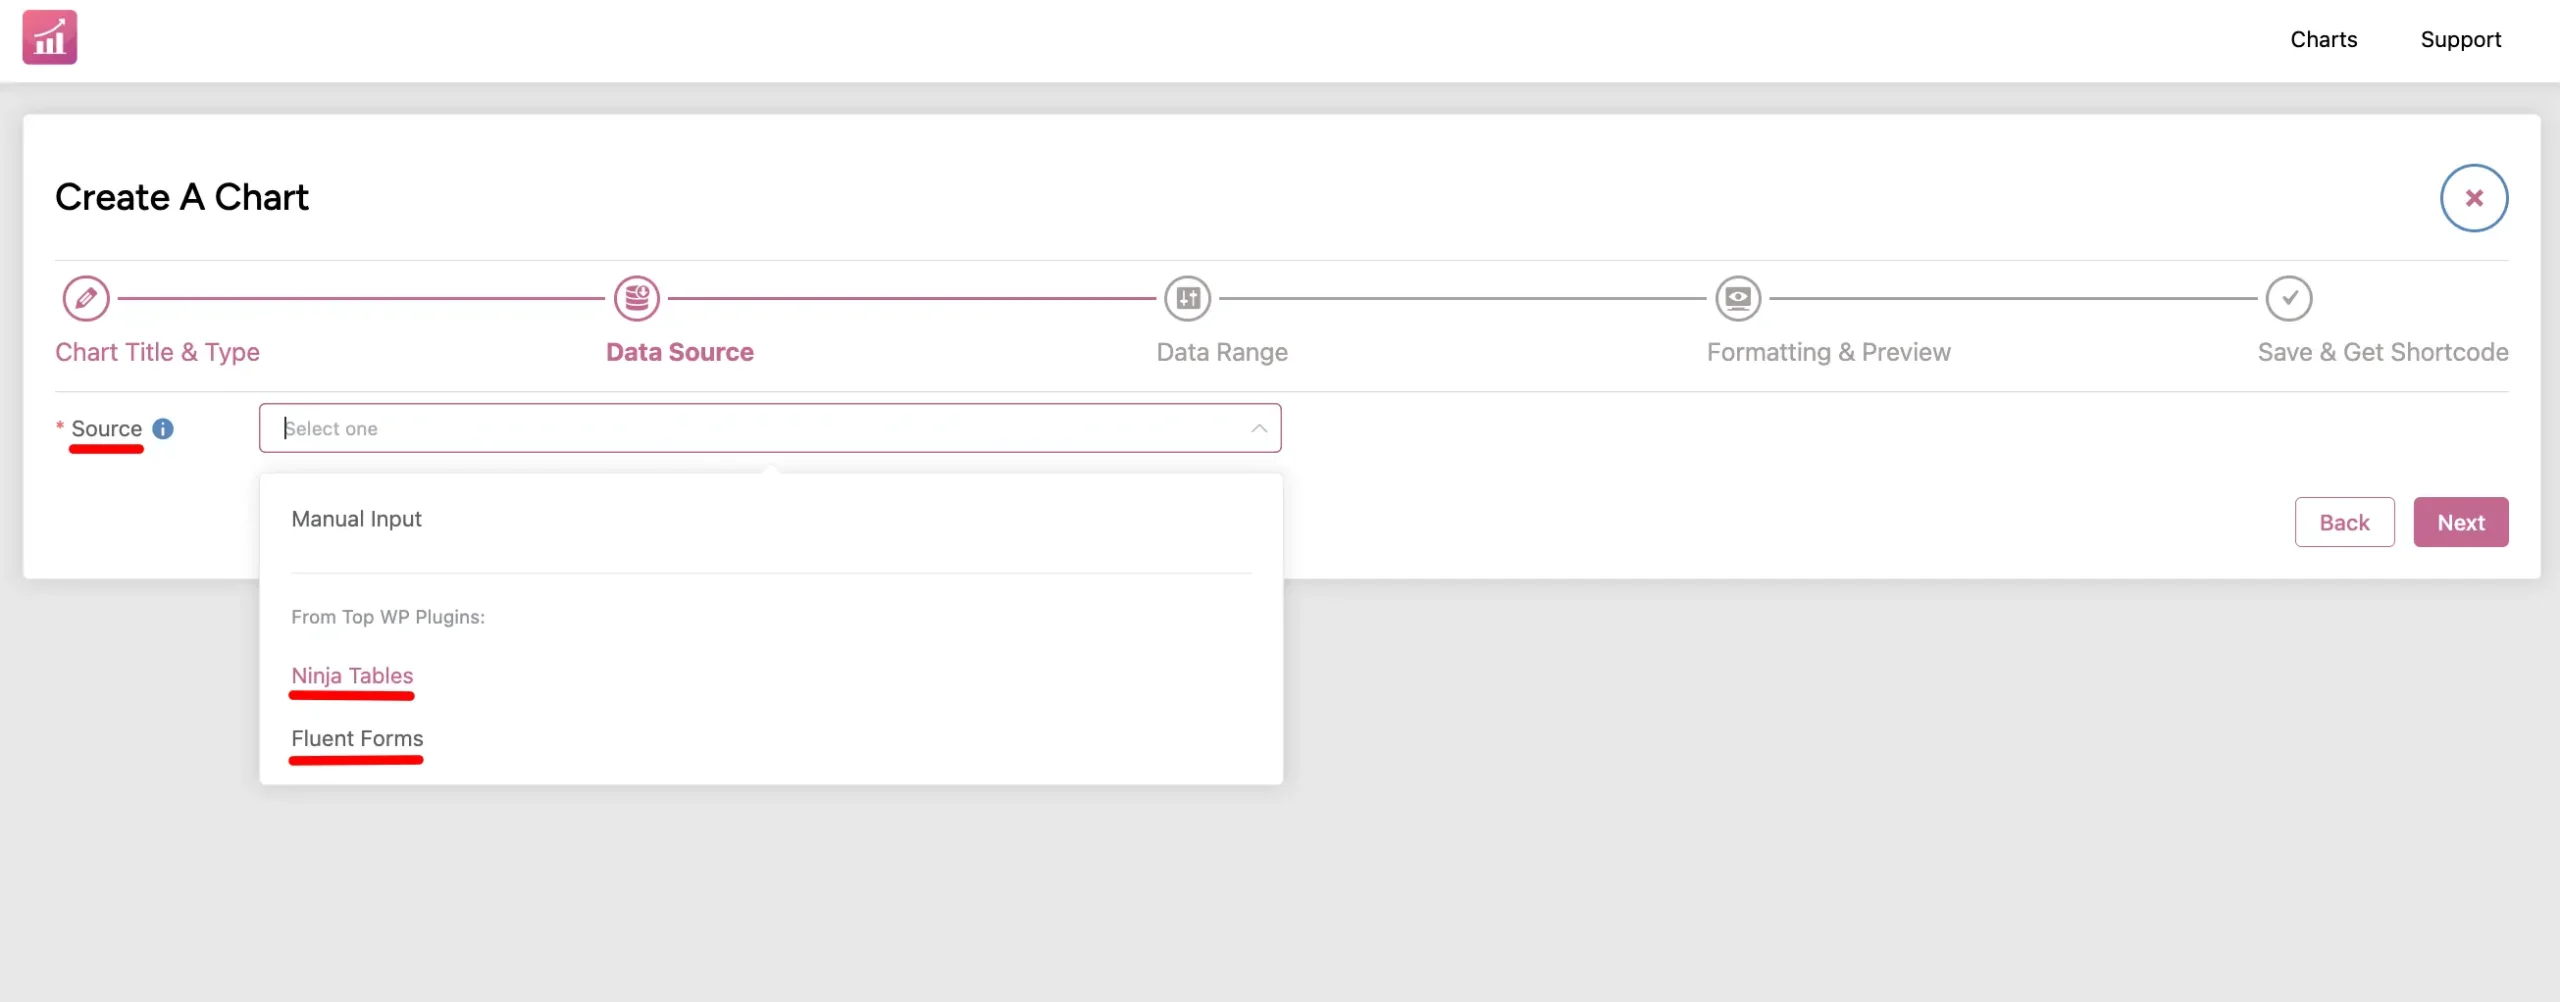
Here, we’ve selected Ninja Tables as the data source as an example.
- Now, select the table you want to turn into a chart from the dropdown.
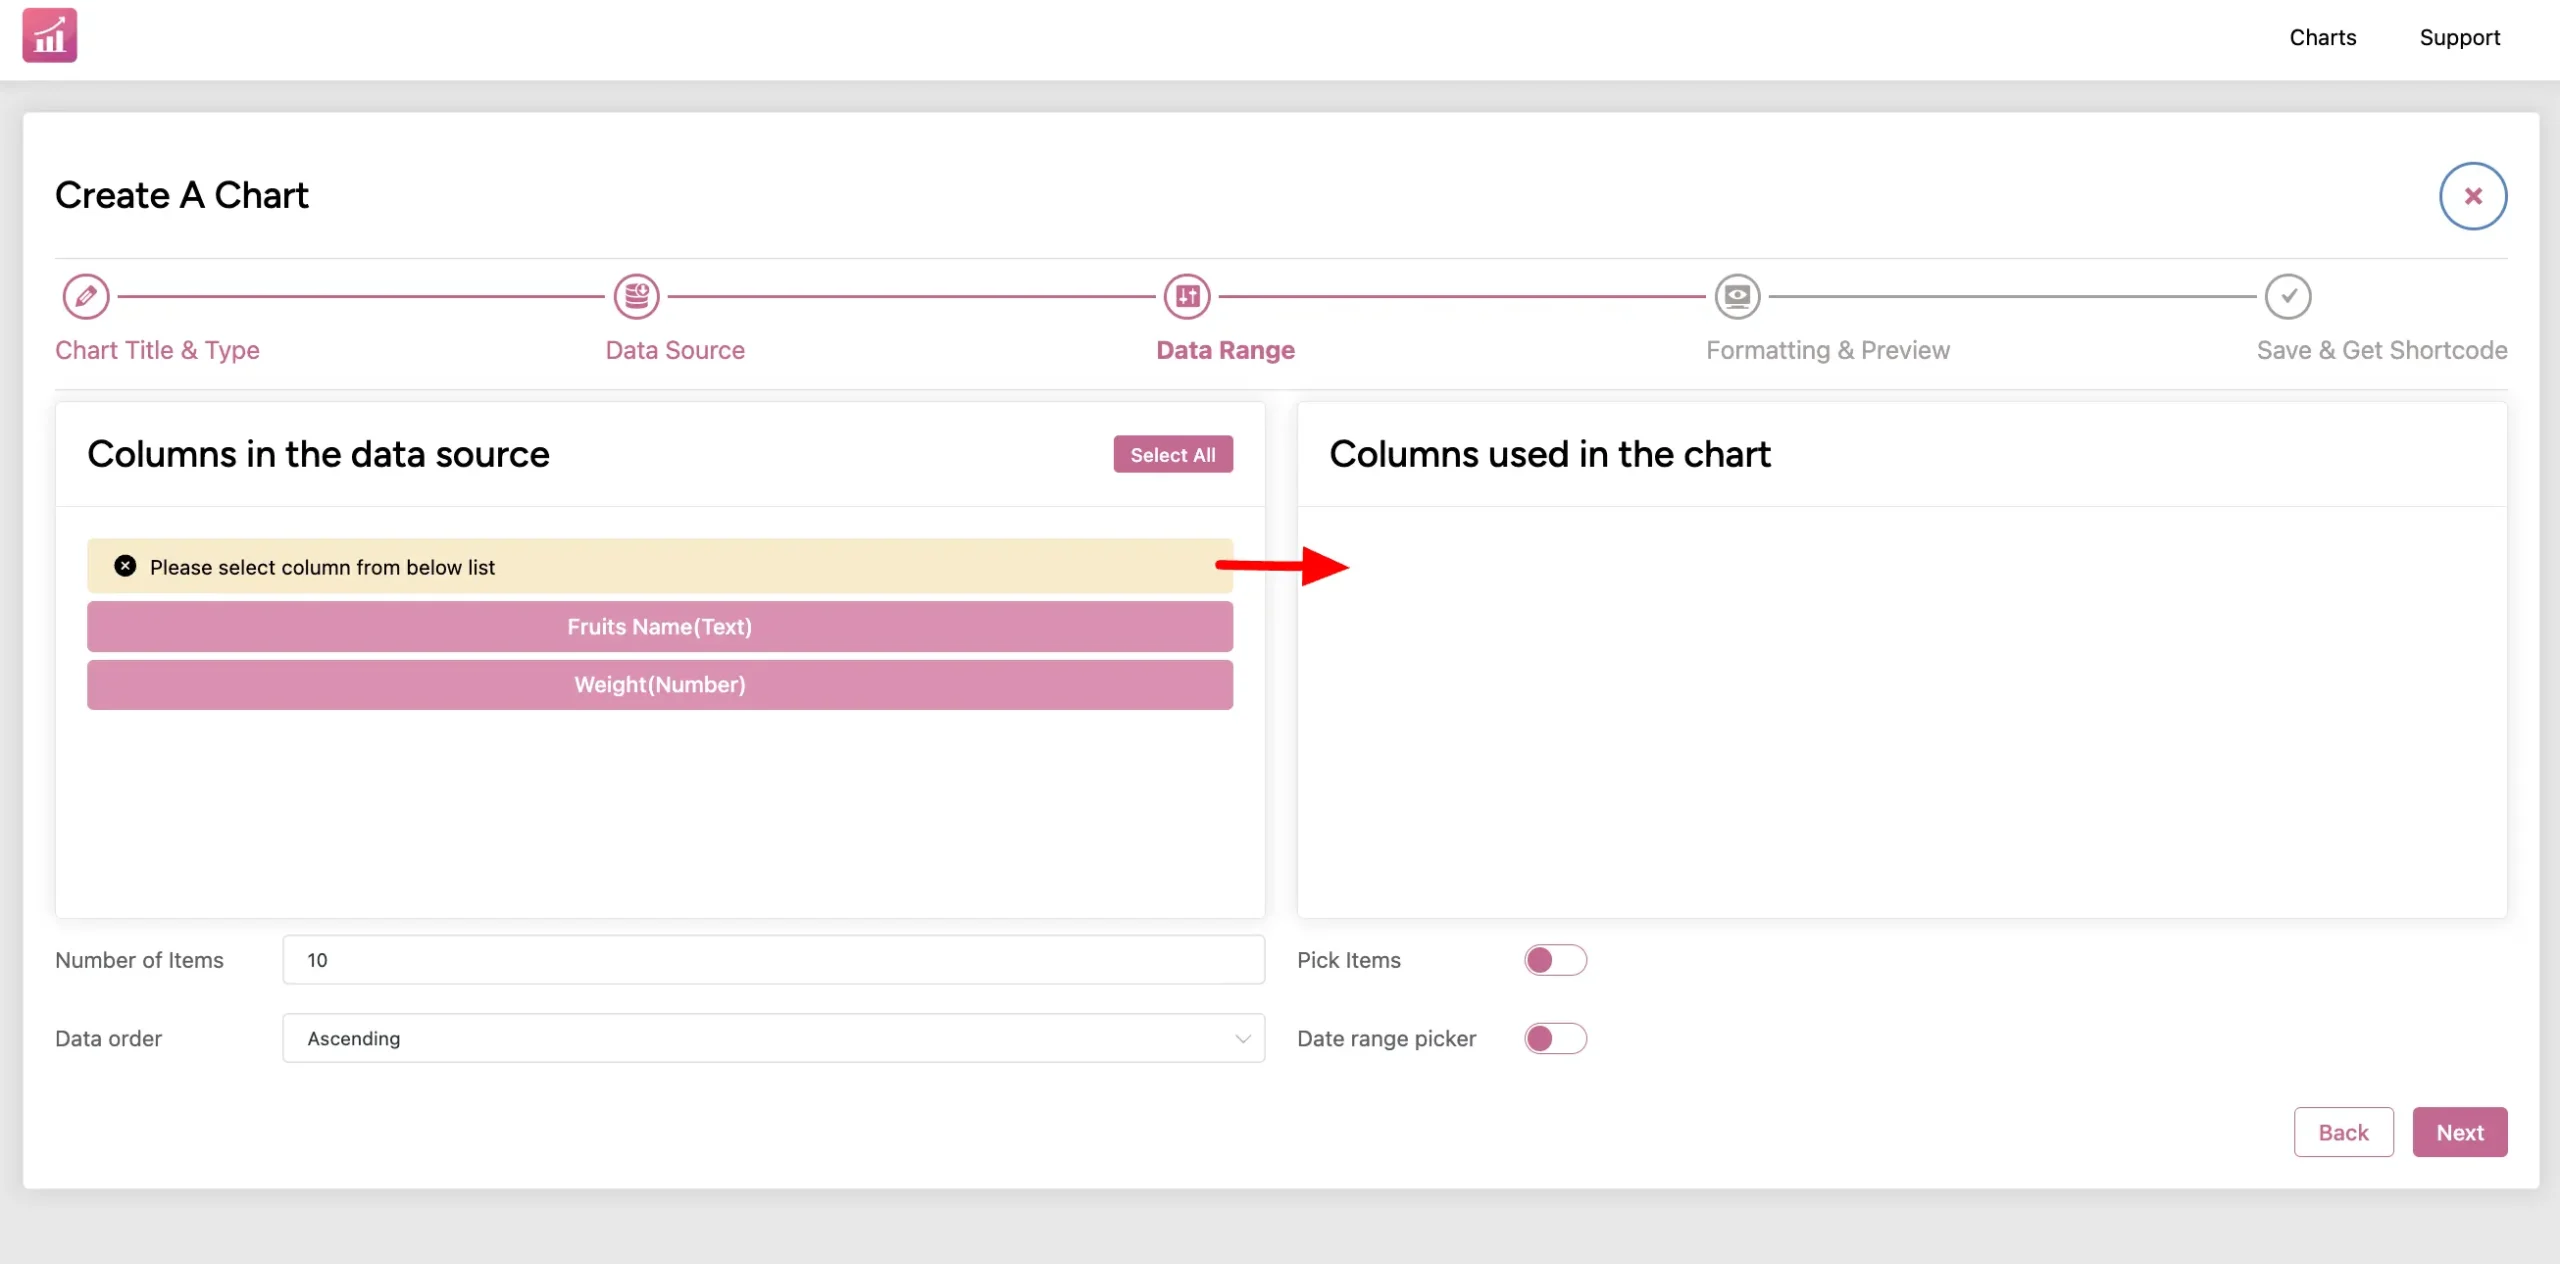
- Hit Next and now you’re in the Data Range tab where you can choose what table entries you want in your chart.
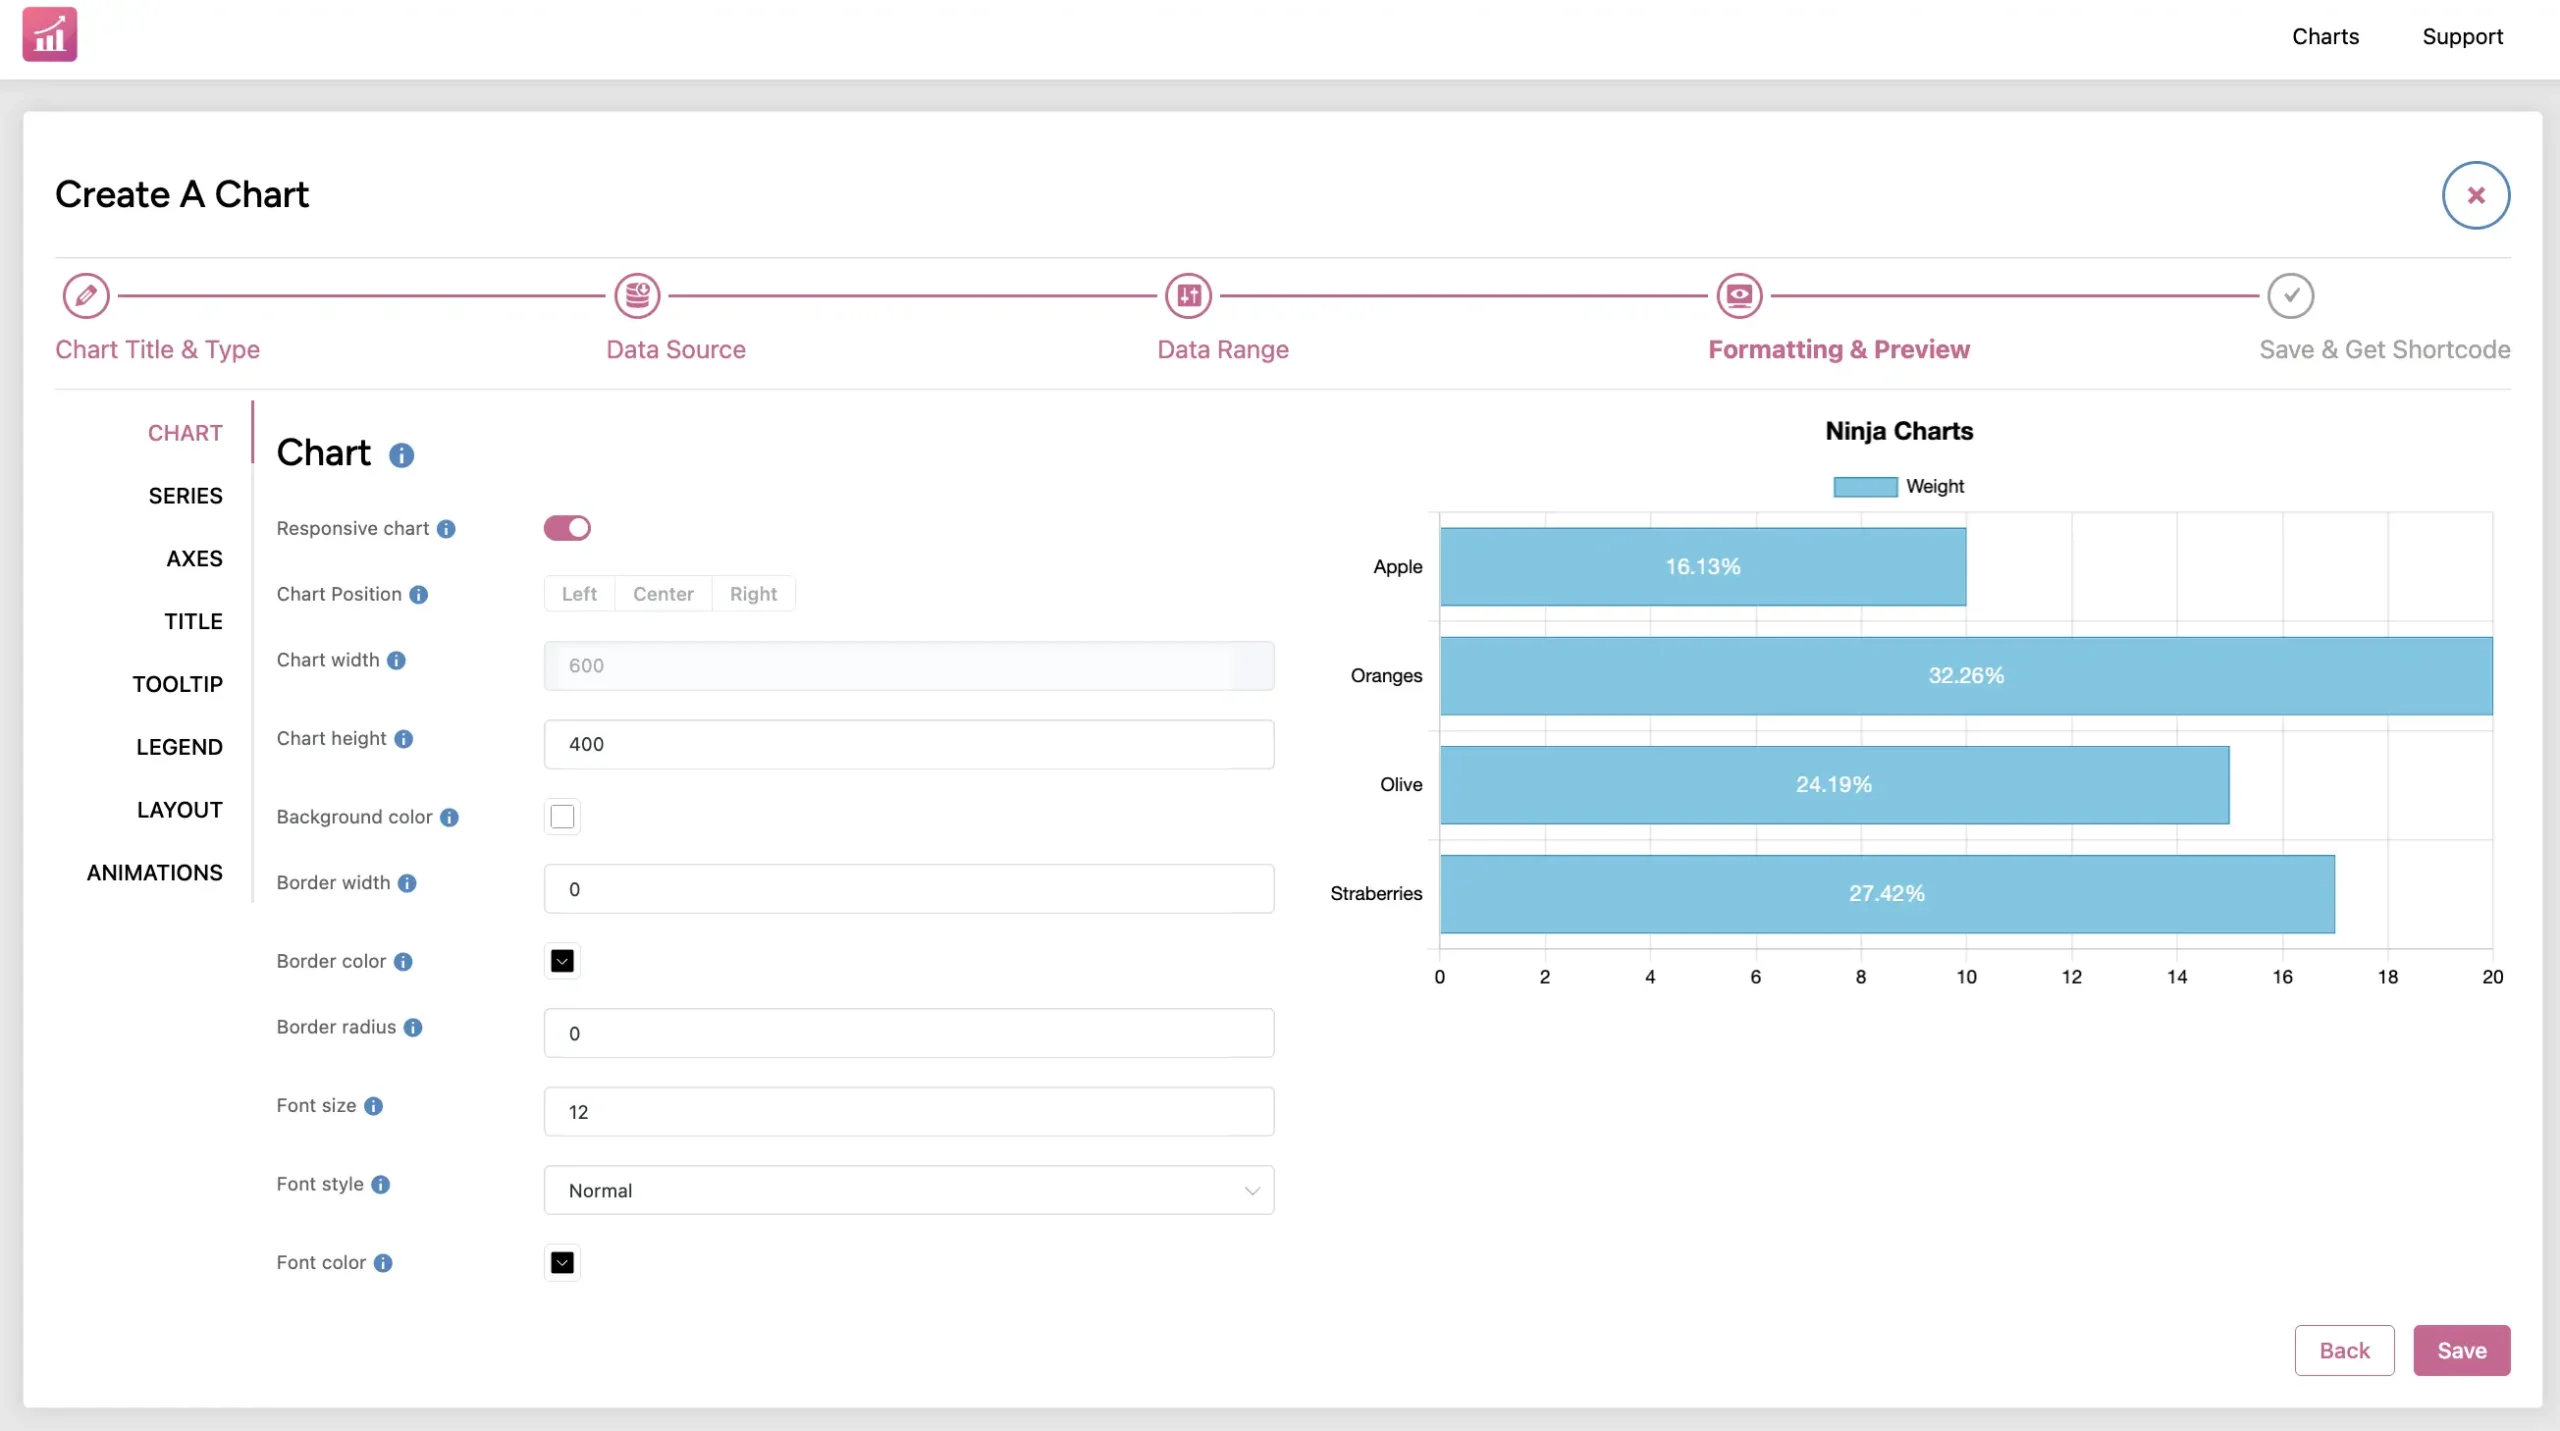
- You can customize it all you want in the Formatting & Preview tab.
So, here’s the Horizontal Bar chart by Ninja Charts made with the chosen data table in Ninja Tables in the Formatting & Preview tab.
Now hit Save and get the shortcode from the next tab.
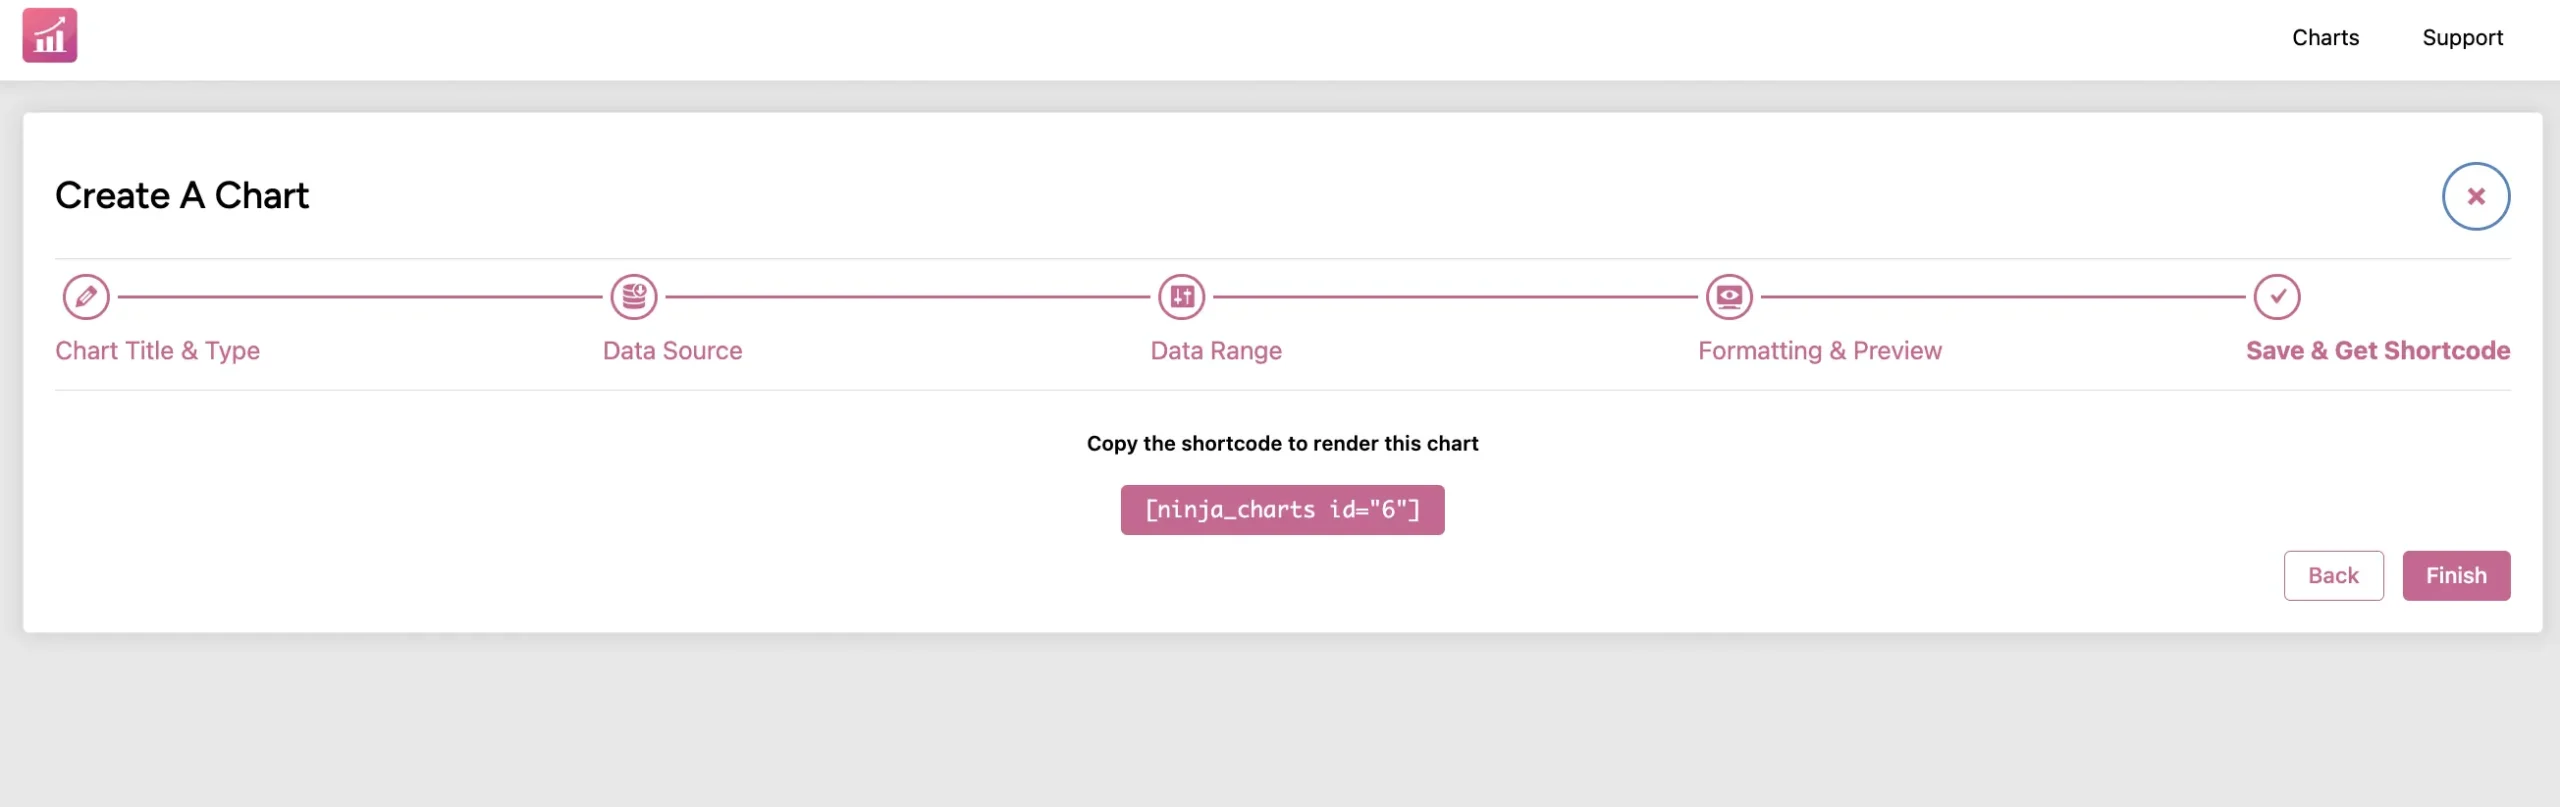
Copy the auto-generated shortcode and paste it anywhere on your website.
This is how you can create different charts using Ninja Charts.


