
Ninja Charts is perfect for creating and embedding unlimited responsive online charts in WordPress websites. You can also customize charts however you need.
This plugin gives you lots of flexibility and fun when it comes to customizing a data chart! In the Formatting & Preview step, you’ll see some advanced options for customizing your charts.
Customizing WordPress Charts in Ninja Charts #
We have this simple guide to show you how to customize Ninja Charts and have fun doing it!
Here are the chart customizing options in the Formatting & Preview step. You can customize Google Charts and Chart Js both following this tutorial.
CHART #
In this tab, 8 customizing options will appear with features like chart coloring, size, fonts, etc.
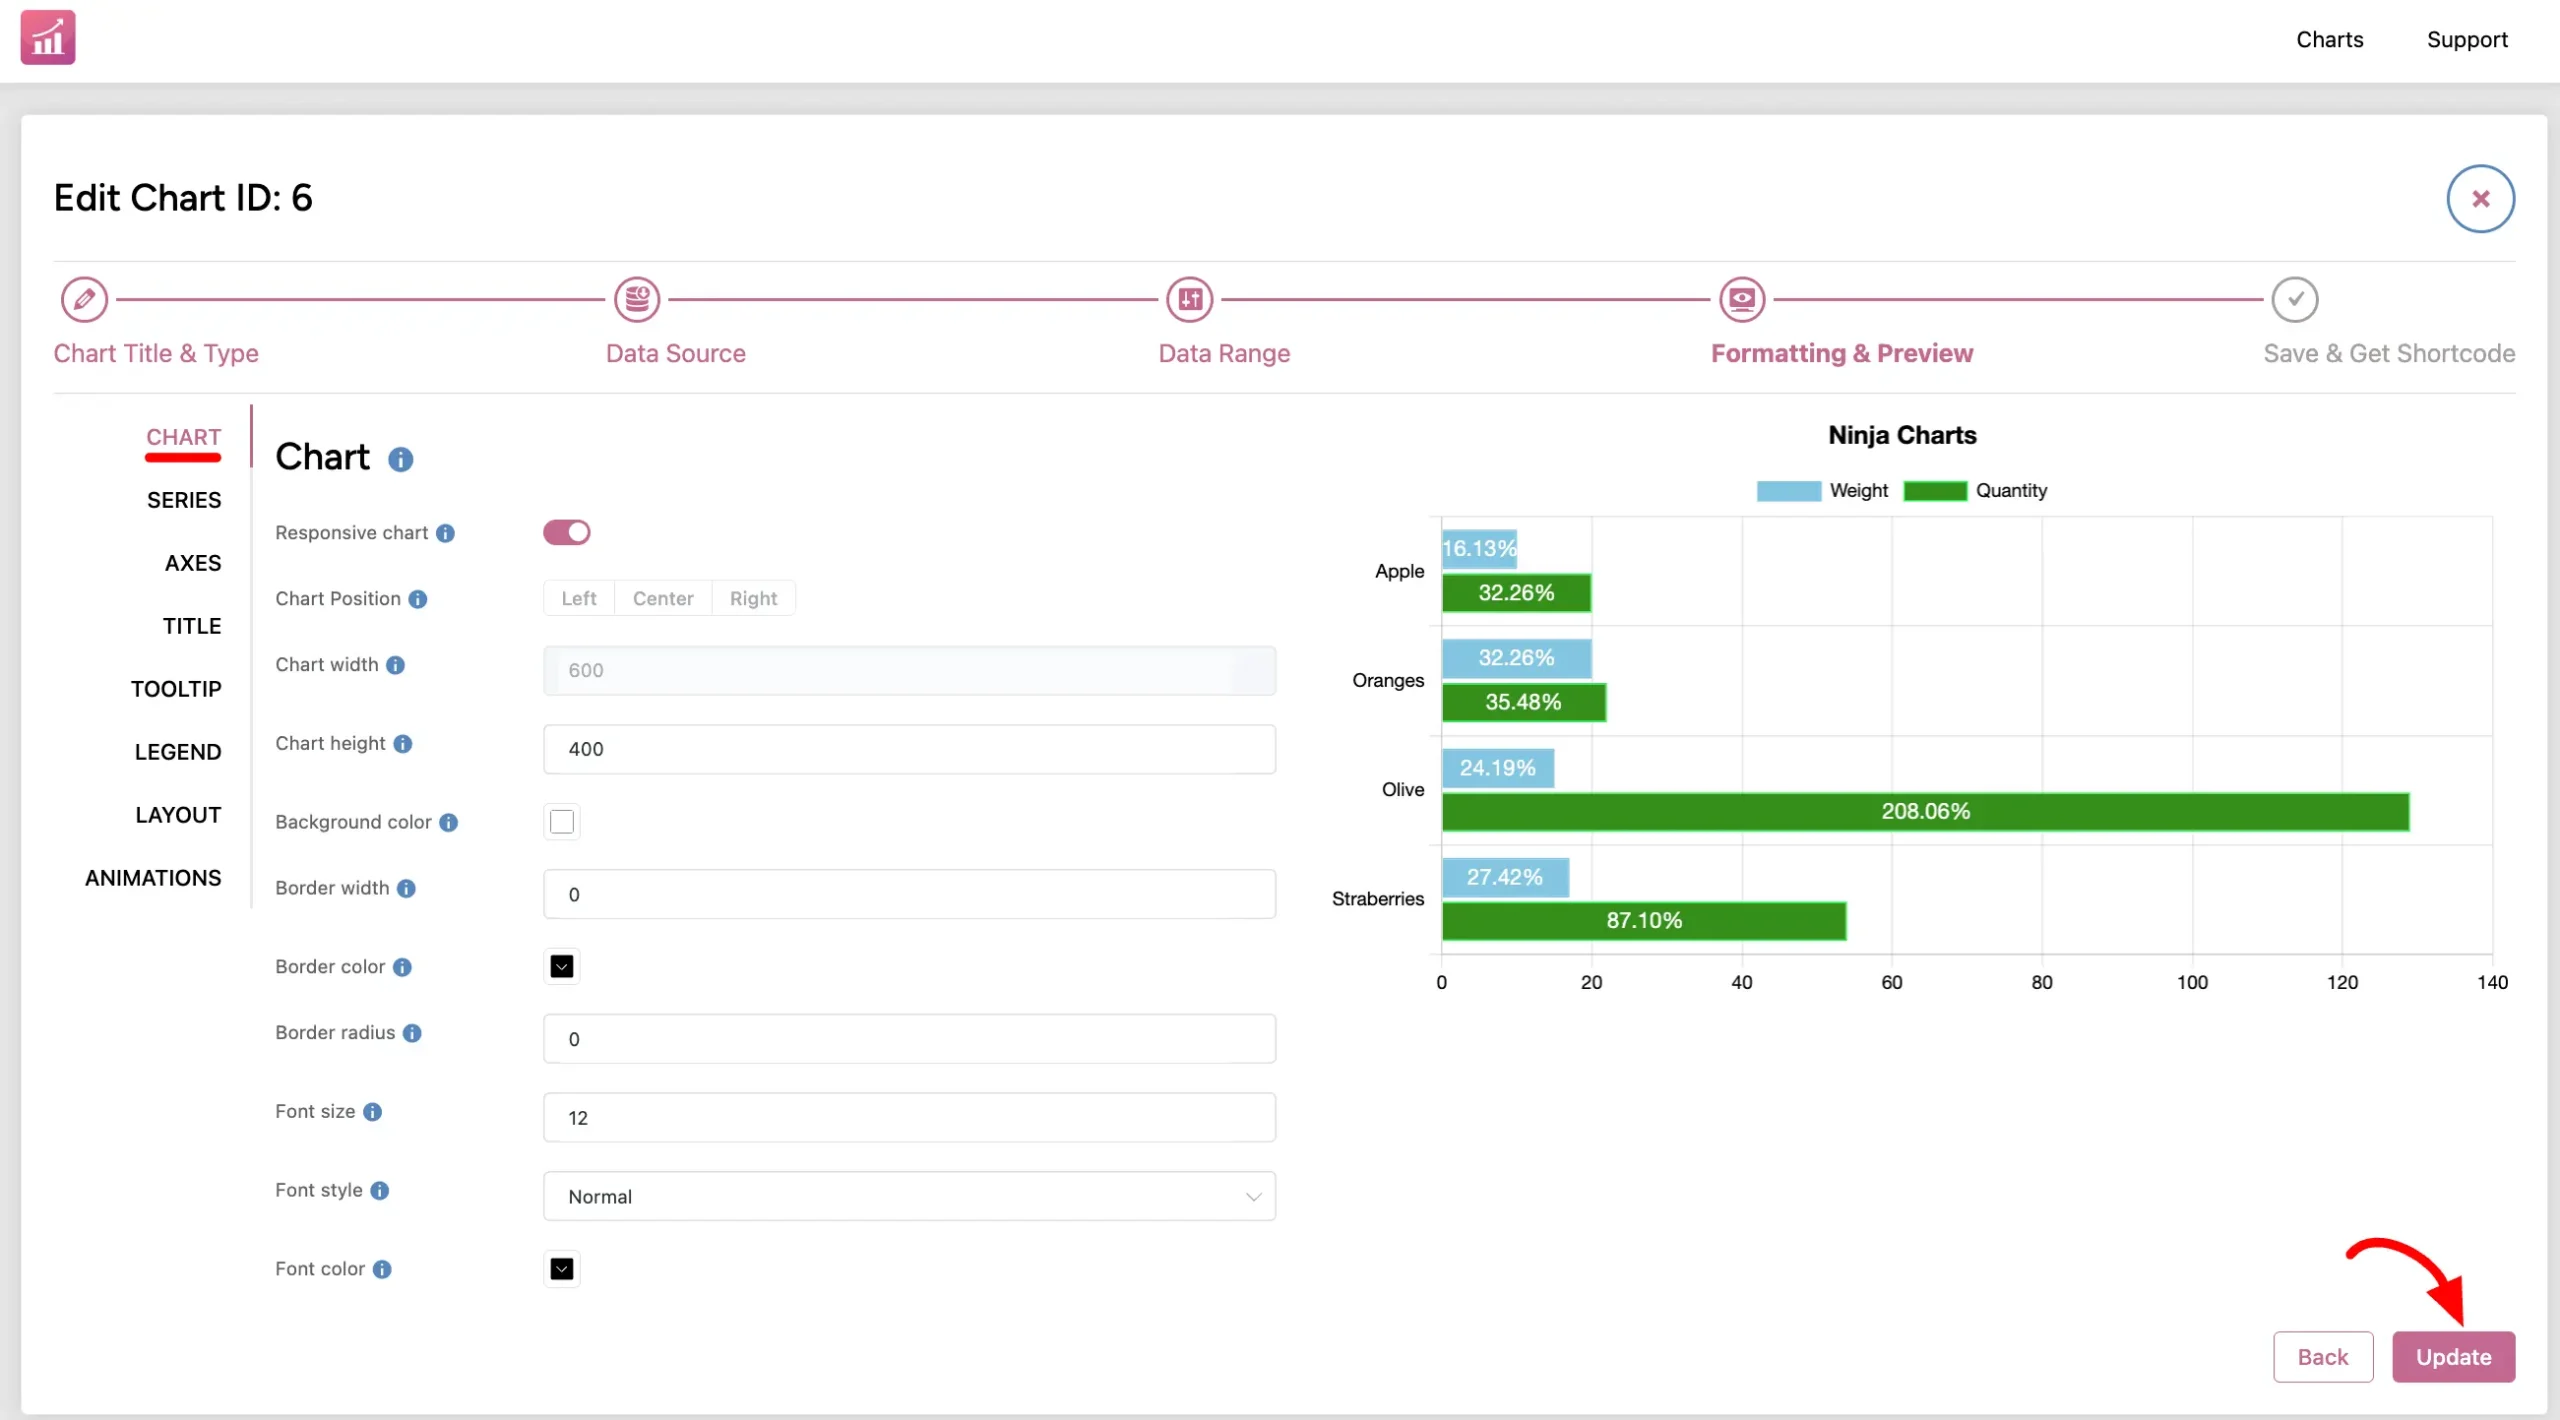
- Responsive chart: Make a responsive online chart by toggling it on.
- Chart width: Customize chart width.
- Chart height: Customize chart height.
- Background color: Change the color of the chart background.
- Border width: Customize border width.
- Border color: Change border color.
- Border radius: Custom chart border radius.
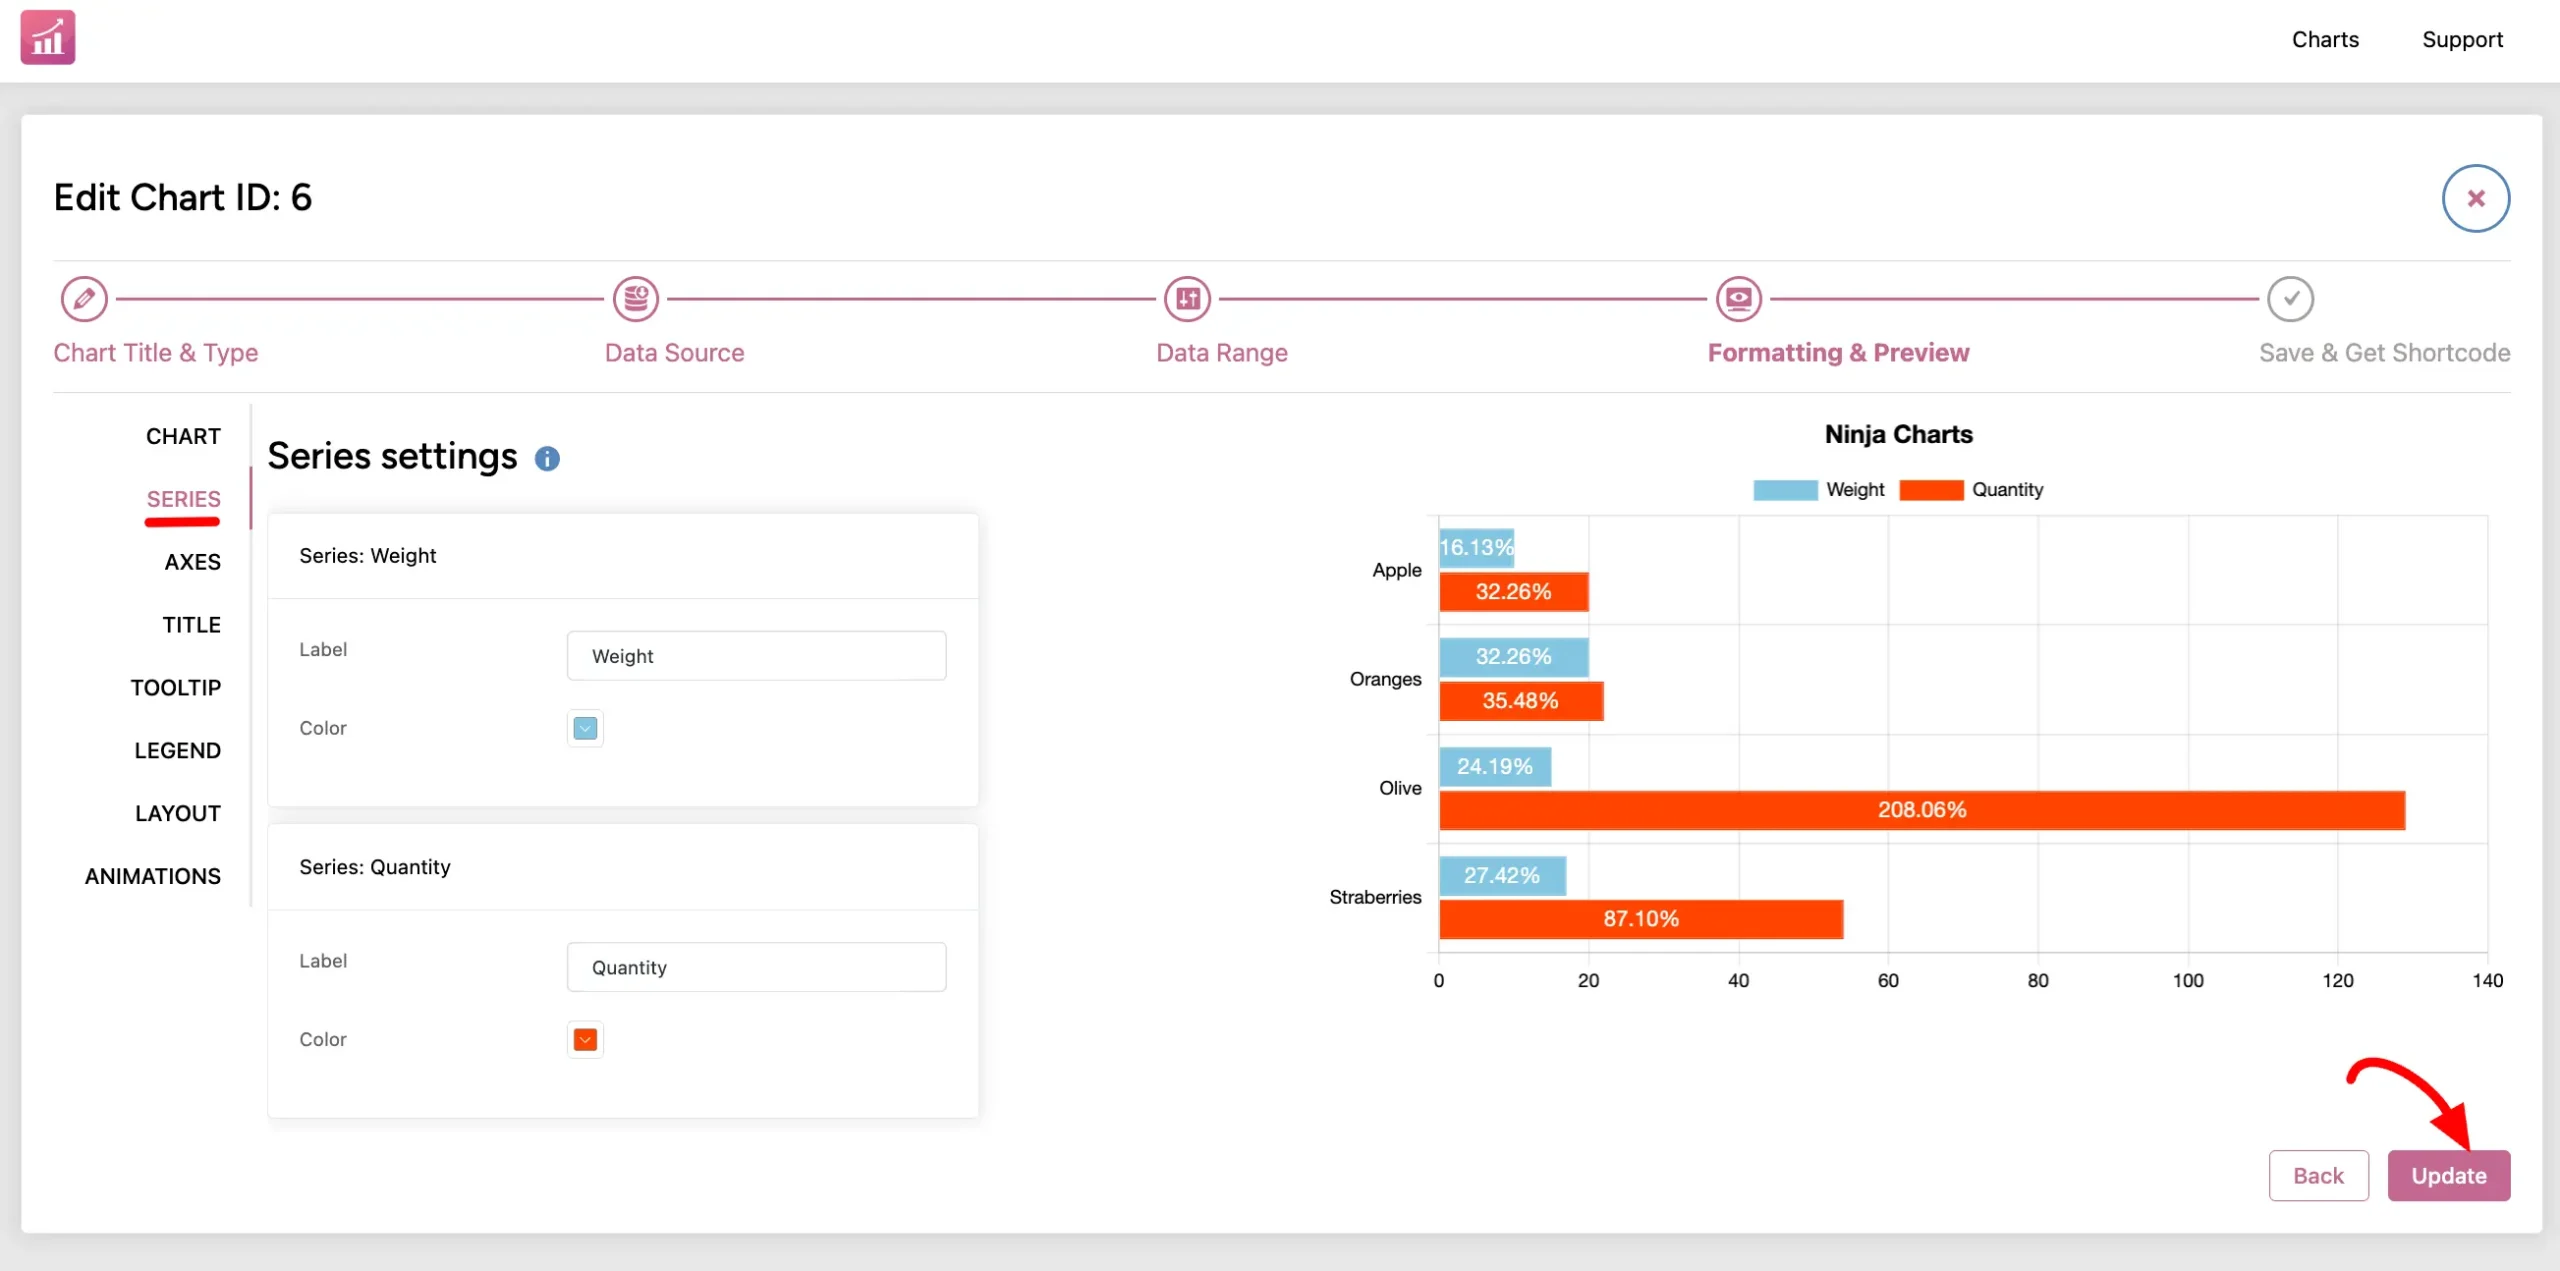
SERIES #
You can redefine the series labels and colors from here.
AXES #
Show grid, control chart stack, or labels.
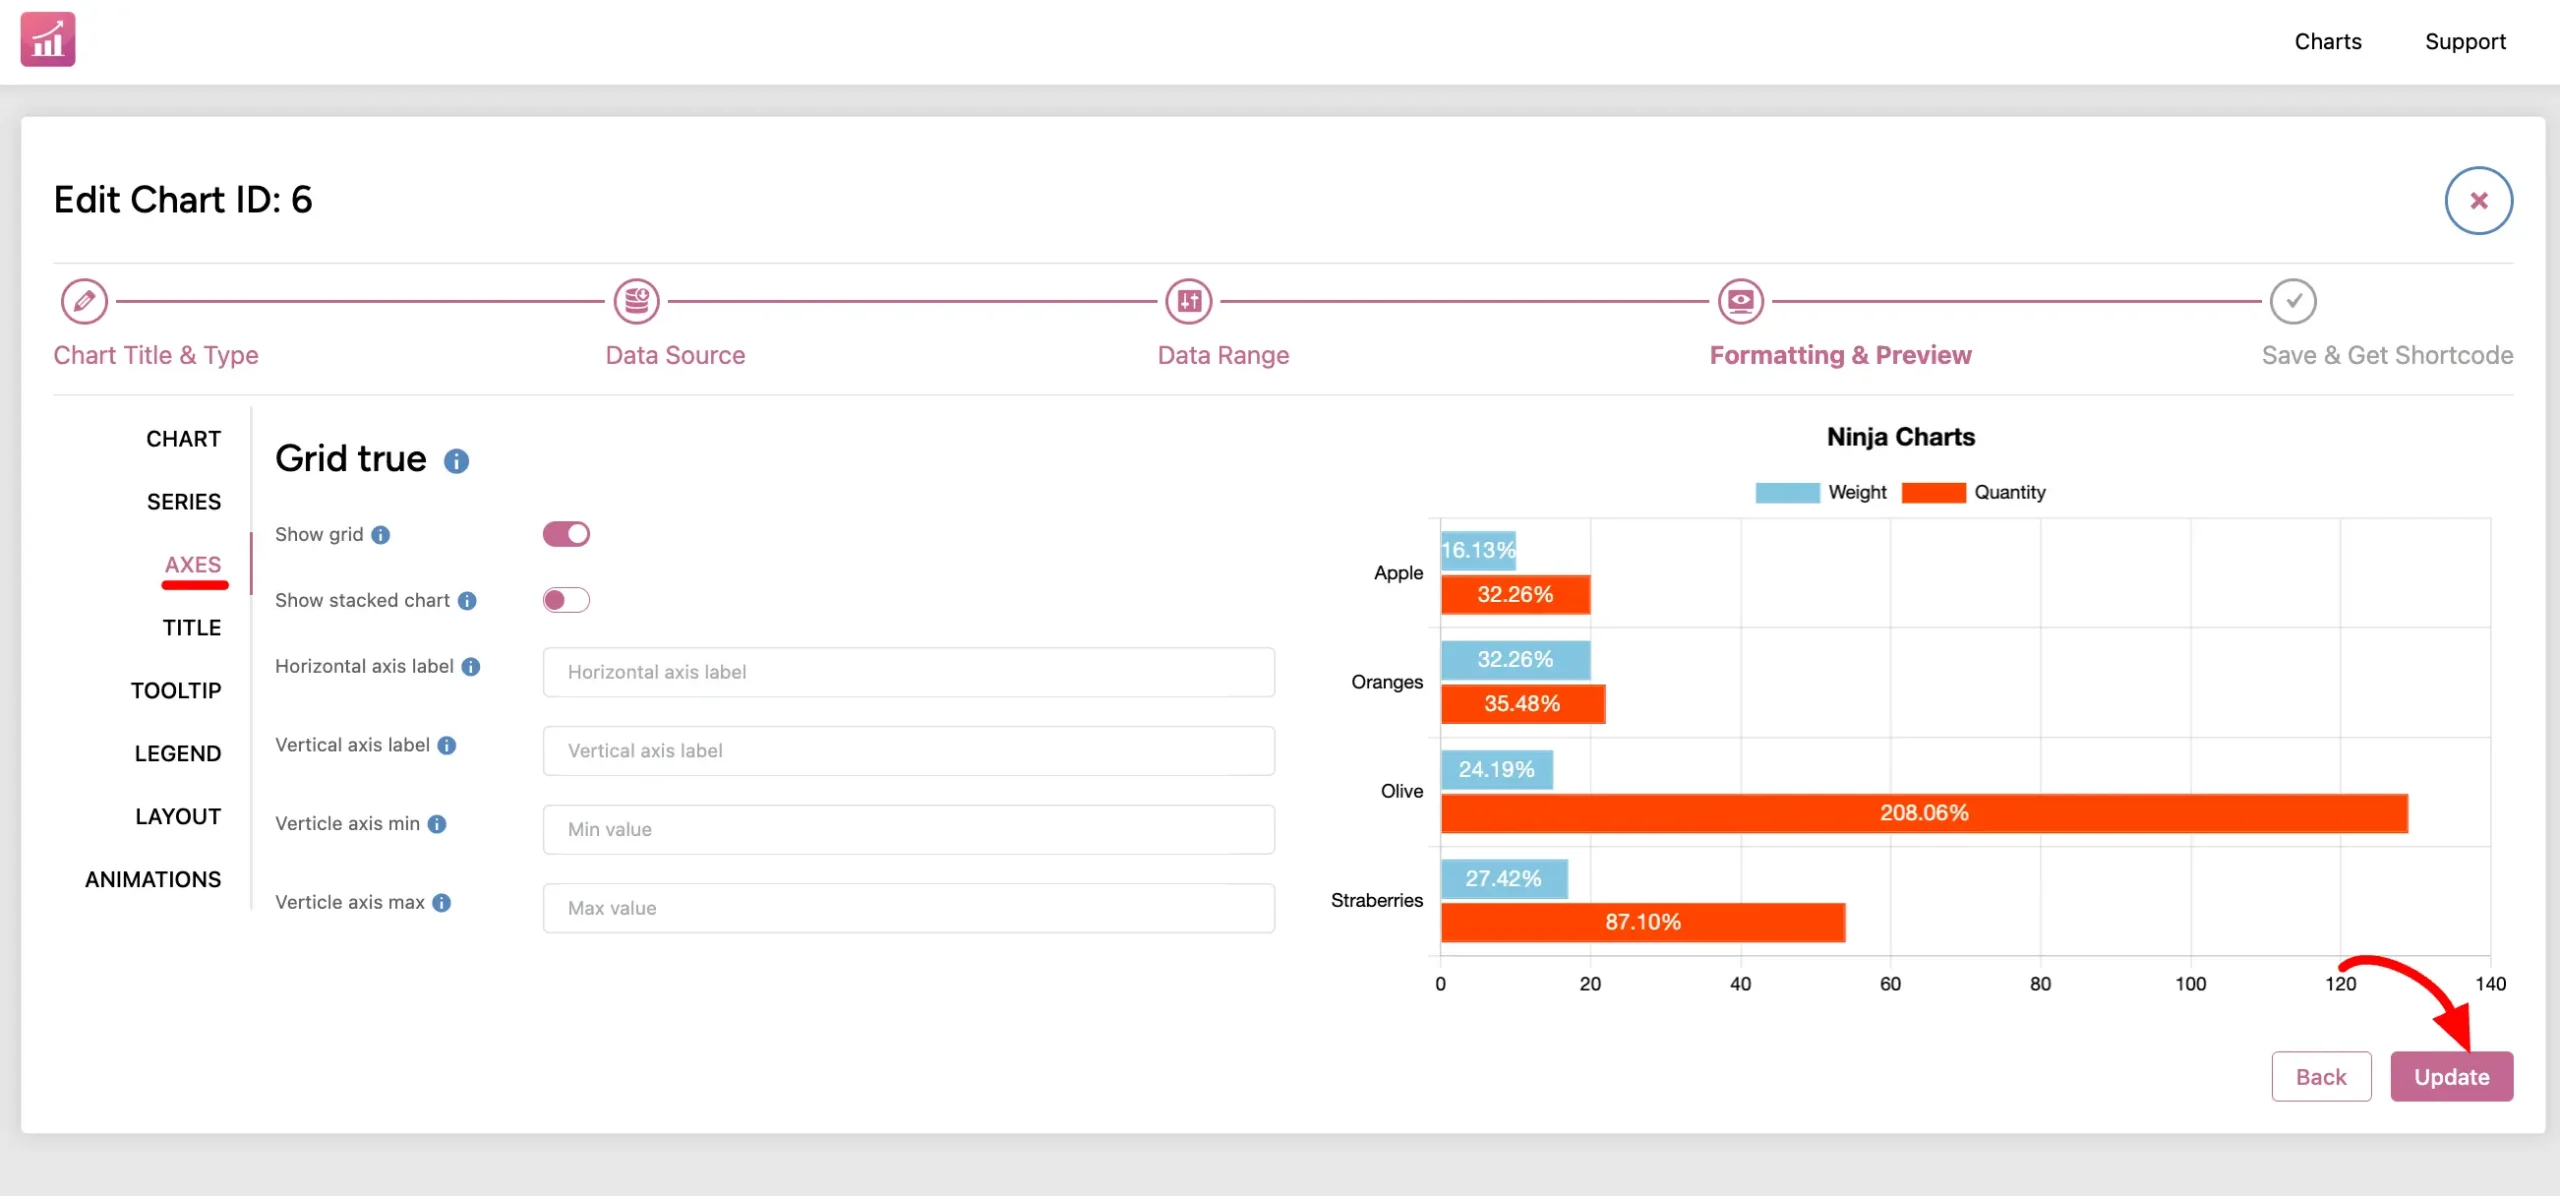
Grid true and Grid false vary in different chart types. Here’s a Horizontal bar chart with Grid true where you can customize what you need. Grid false appears for charts like Pie charts.
- Show grid: Turn it off if you want grid lines in the chart background.
- Show stacked chart: Turn it off if you want the chart data to stack (This won’t appear for charts like Pie Chart).
- Horizontal axis label: Custom labeling of the horizontal axis.
- Vertical axis label: Custom labeling of the vertical axis.
- Vertical axis min: Custom minimum value of the vertical axis.
- Vertical axis max: Custom maximum value of the vertical axis.
TITLE #
Control chart title visibility, appearance, and position.
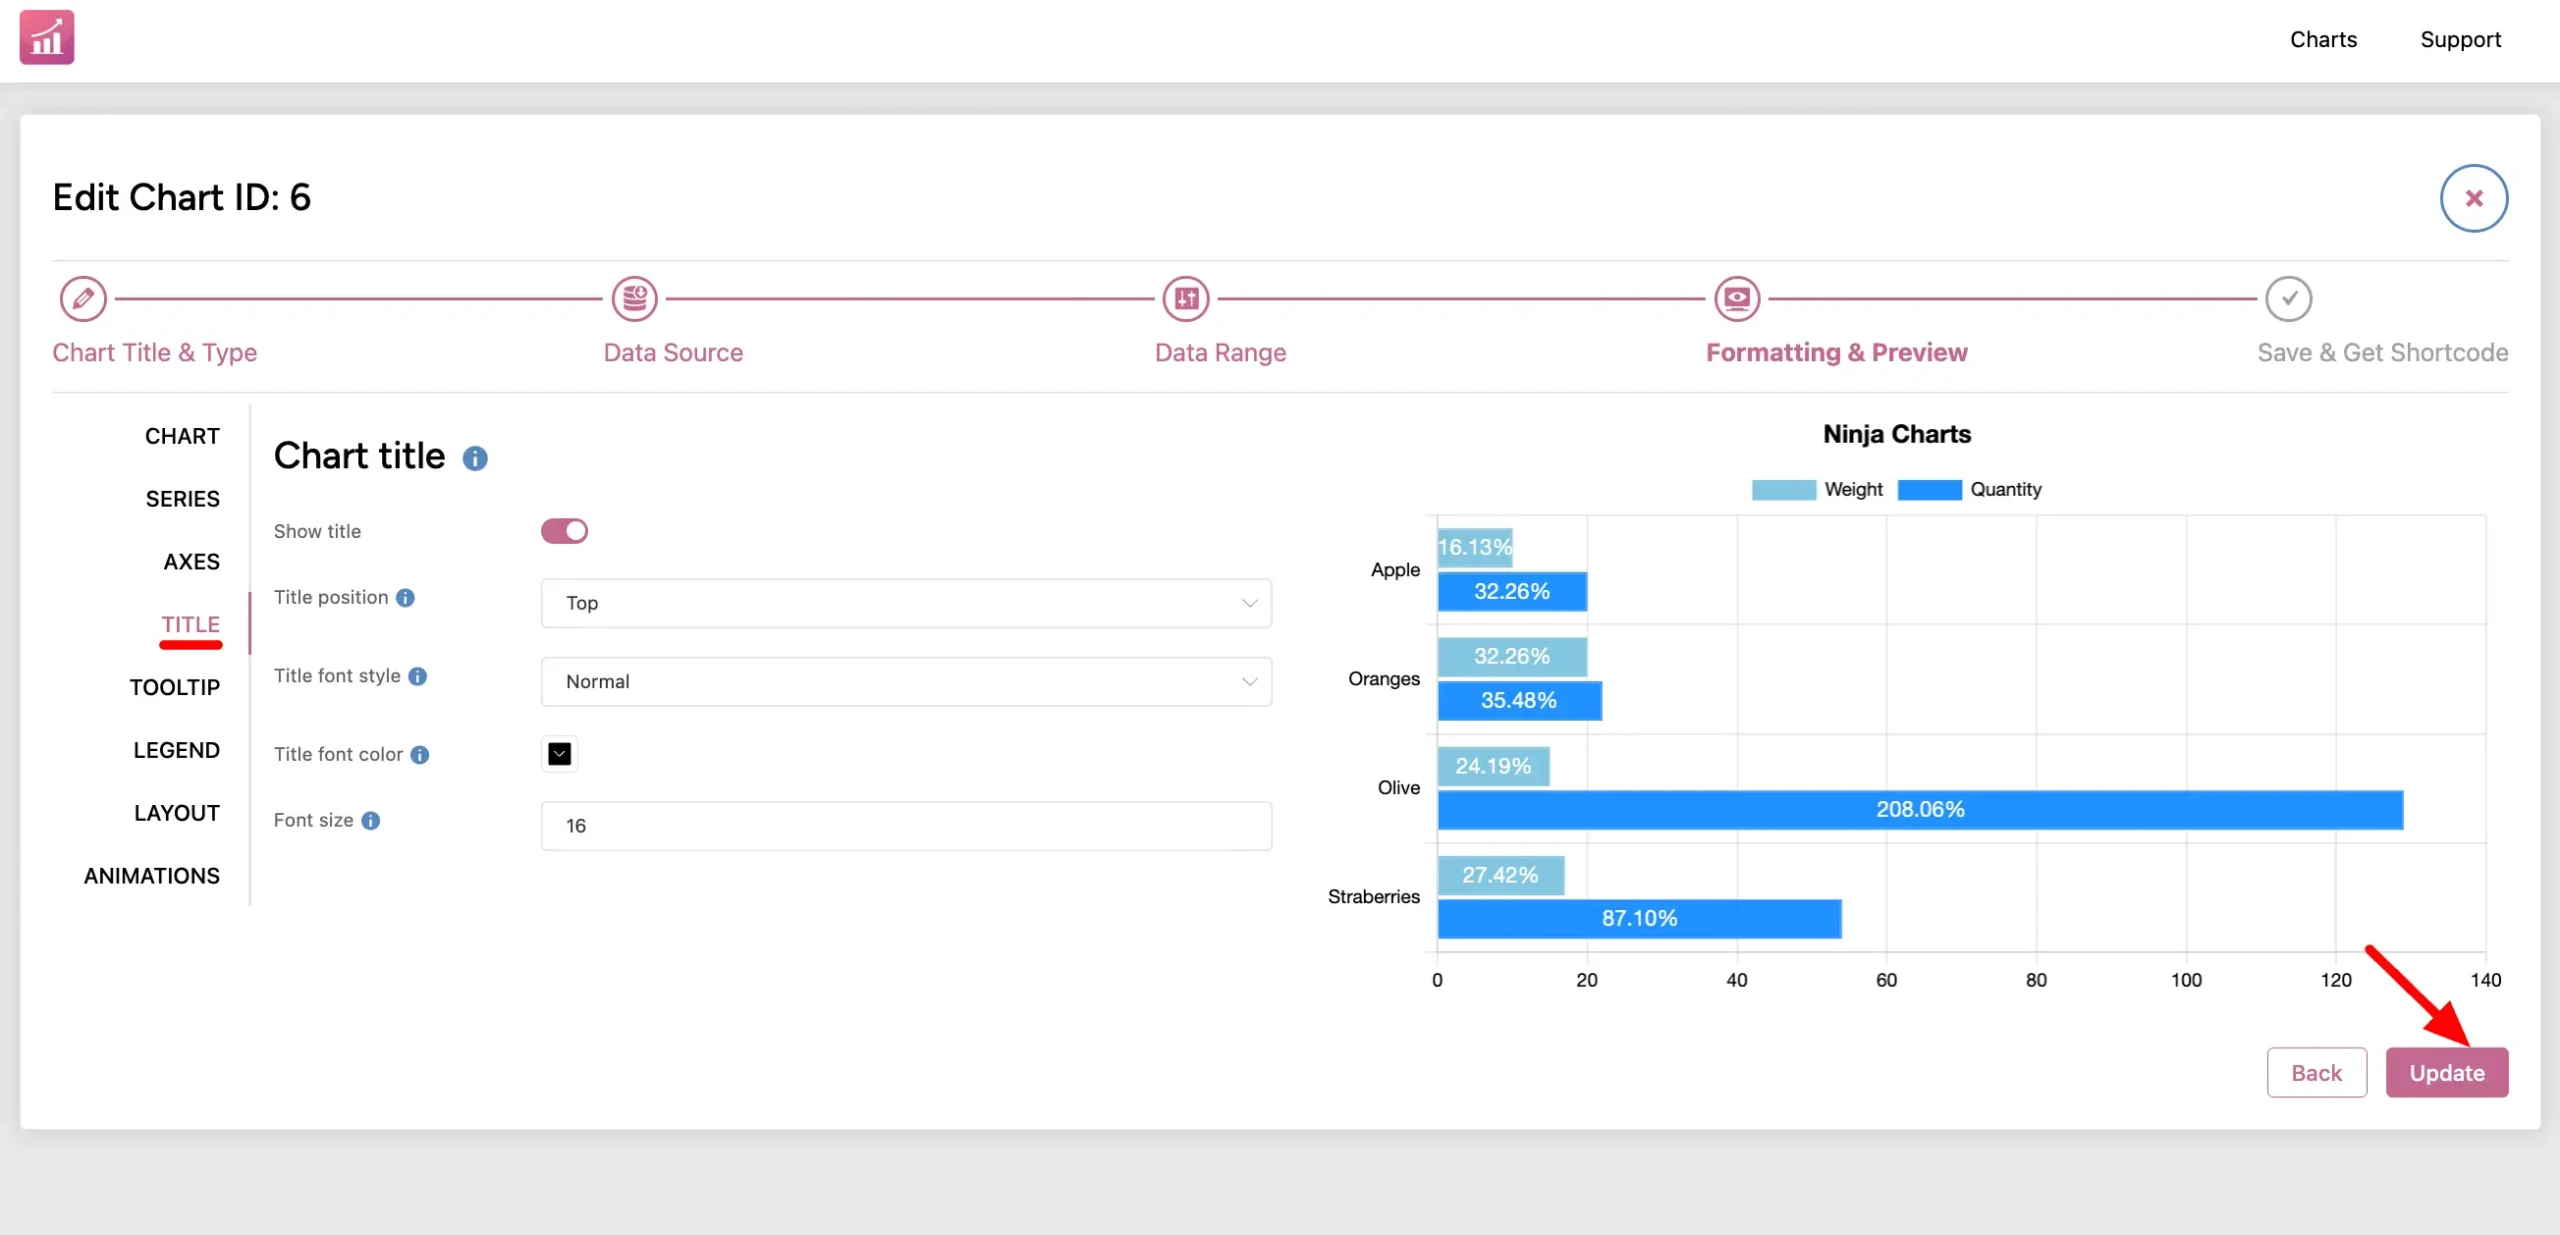
- Show title: Toggle on if you want the chart title to show up.
- Title position: Change chart title position- Top, Bottom, Left, and Right.
- Title font style: Change chart title font- Normal, Italic, Bold.
- Title font color: Customize the title font color from the RGB palette.
- Font size: Change font size.
TOOLTIP #
Control chart tooltip appearance, visibility, and width.
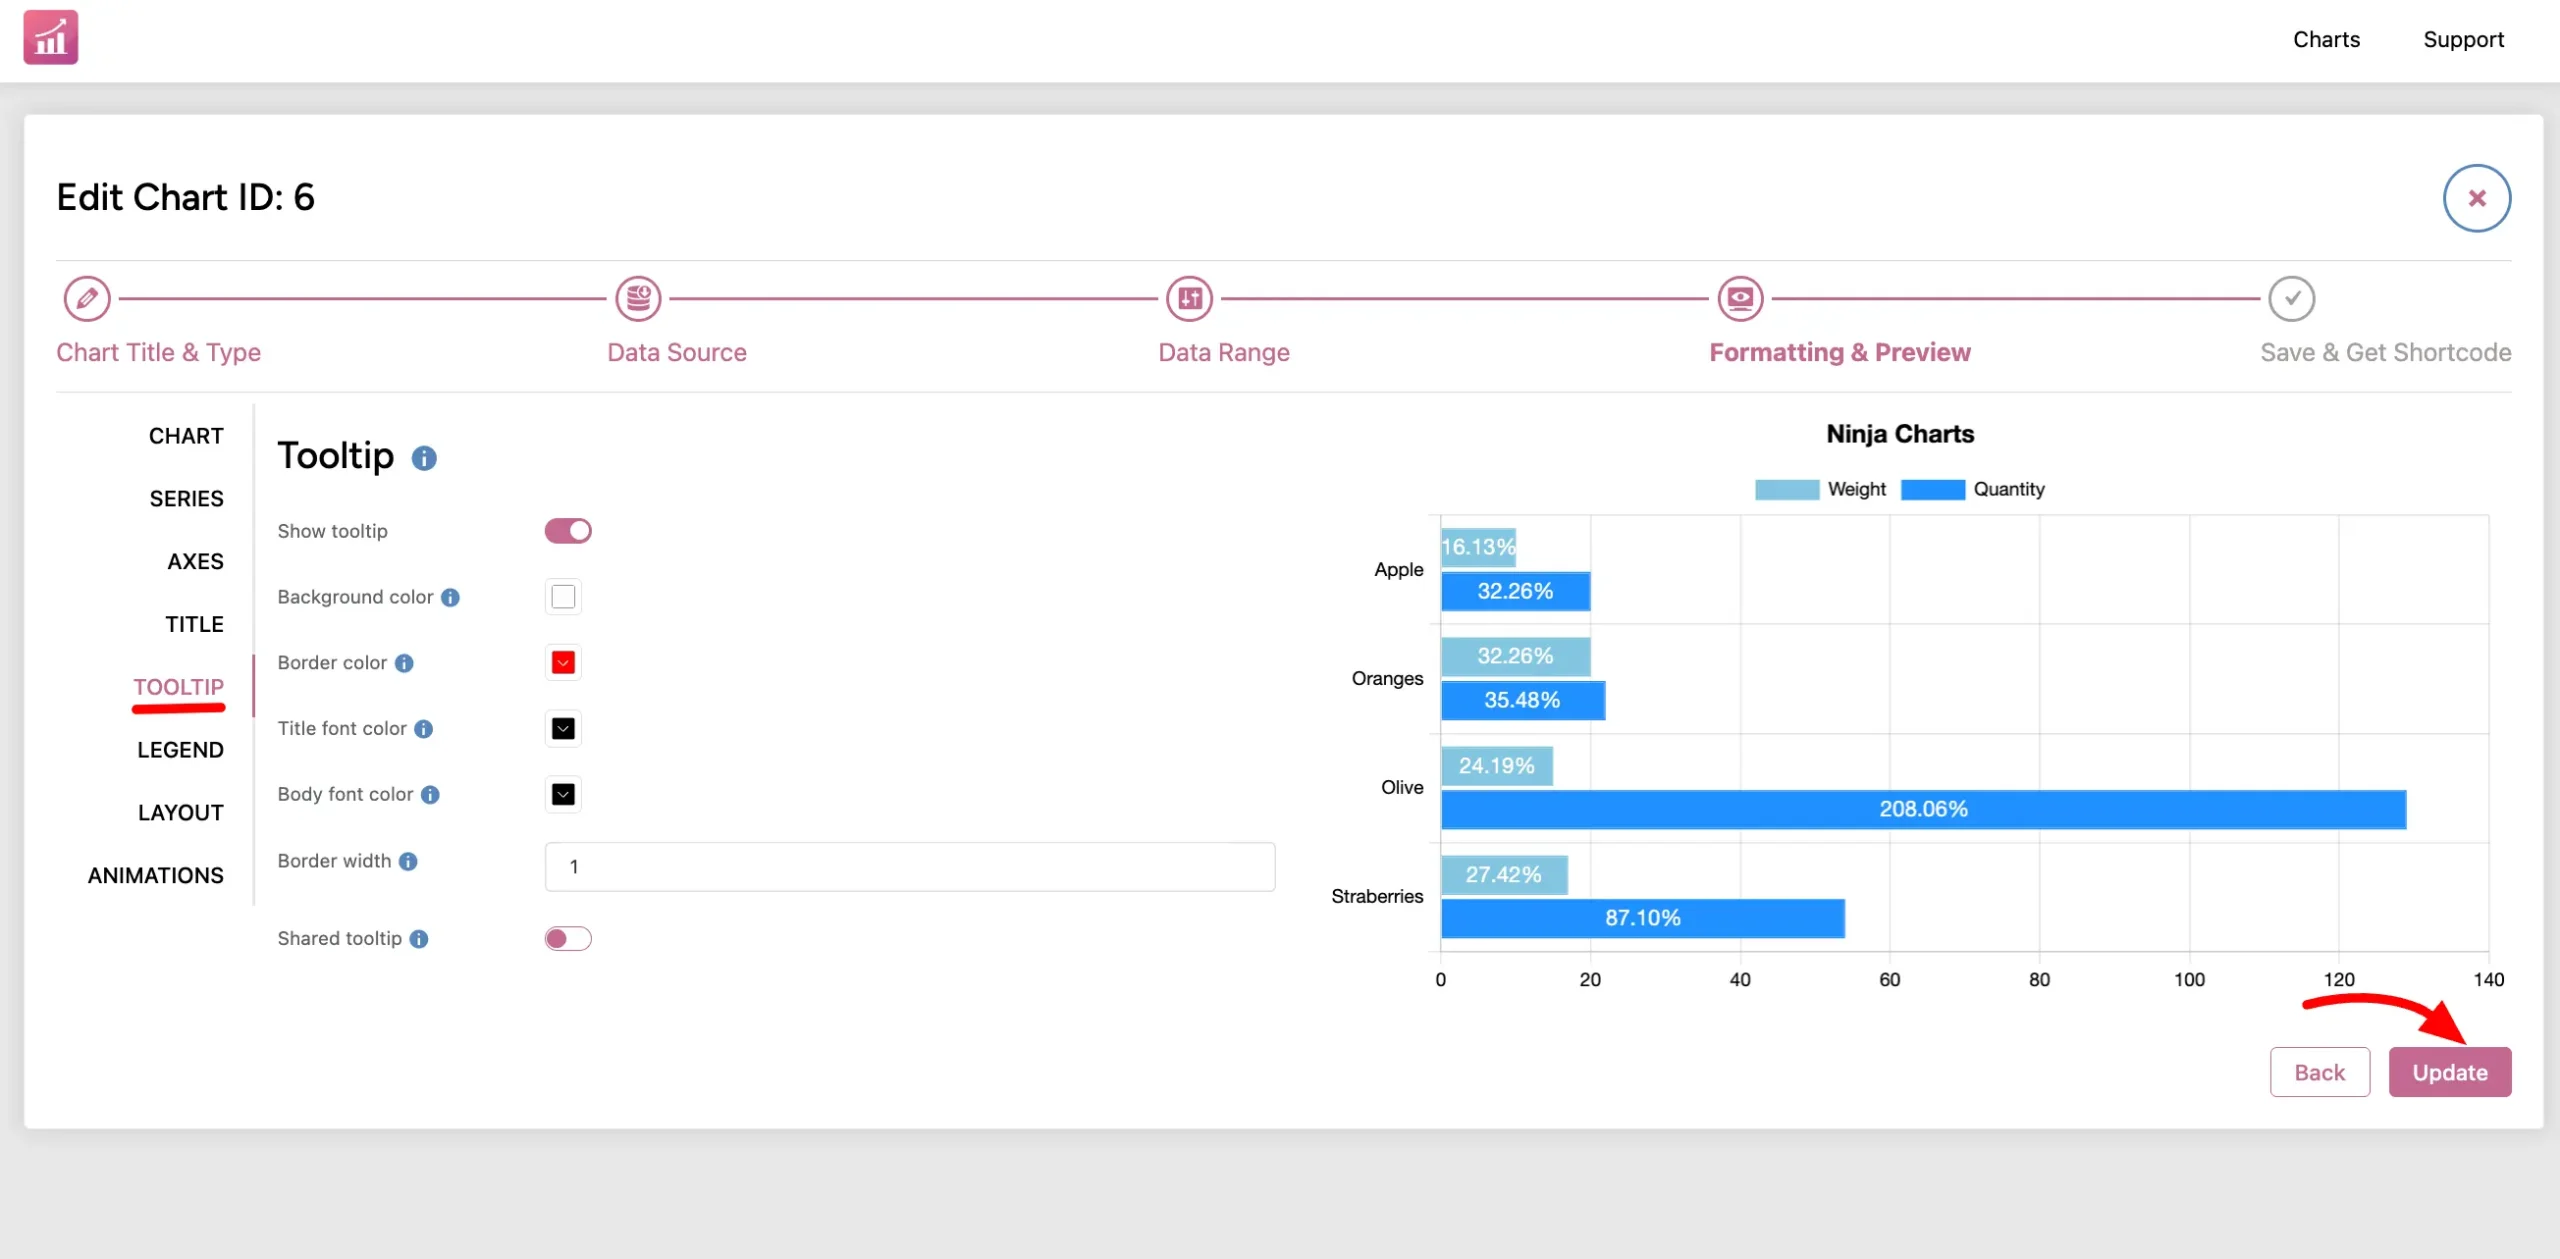
- Show tooltip: Turn it on for the tooltip to appear.
- Background color: Change the tooltip background color.
- Border color: Change the tooltip border color.
- Title font color: Custom tooltip font color.
- Body font color: Custom tooltip font color.
- Border width: Pixel width of the tooltip border.
- Shared tooltip: Turn it on to share the tooltip area with the entire plot.
LEGEND #
Customize legend position and appearance.
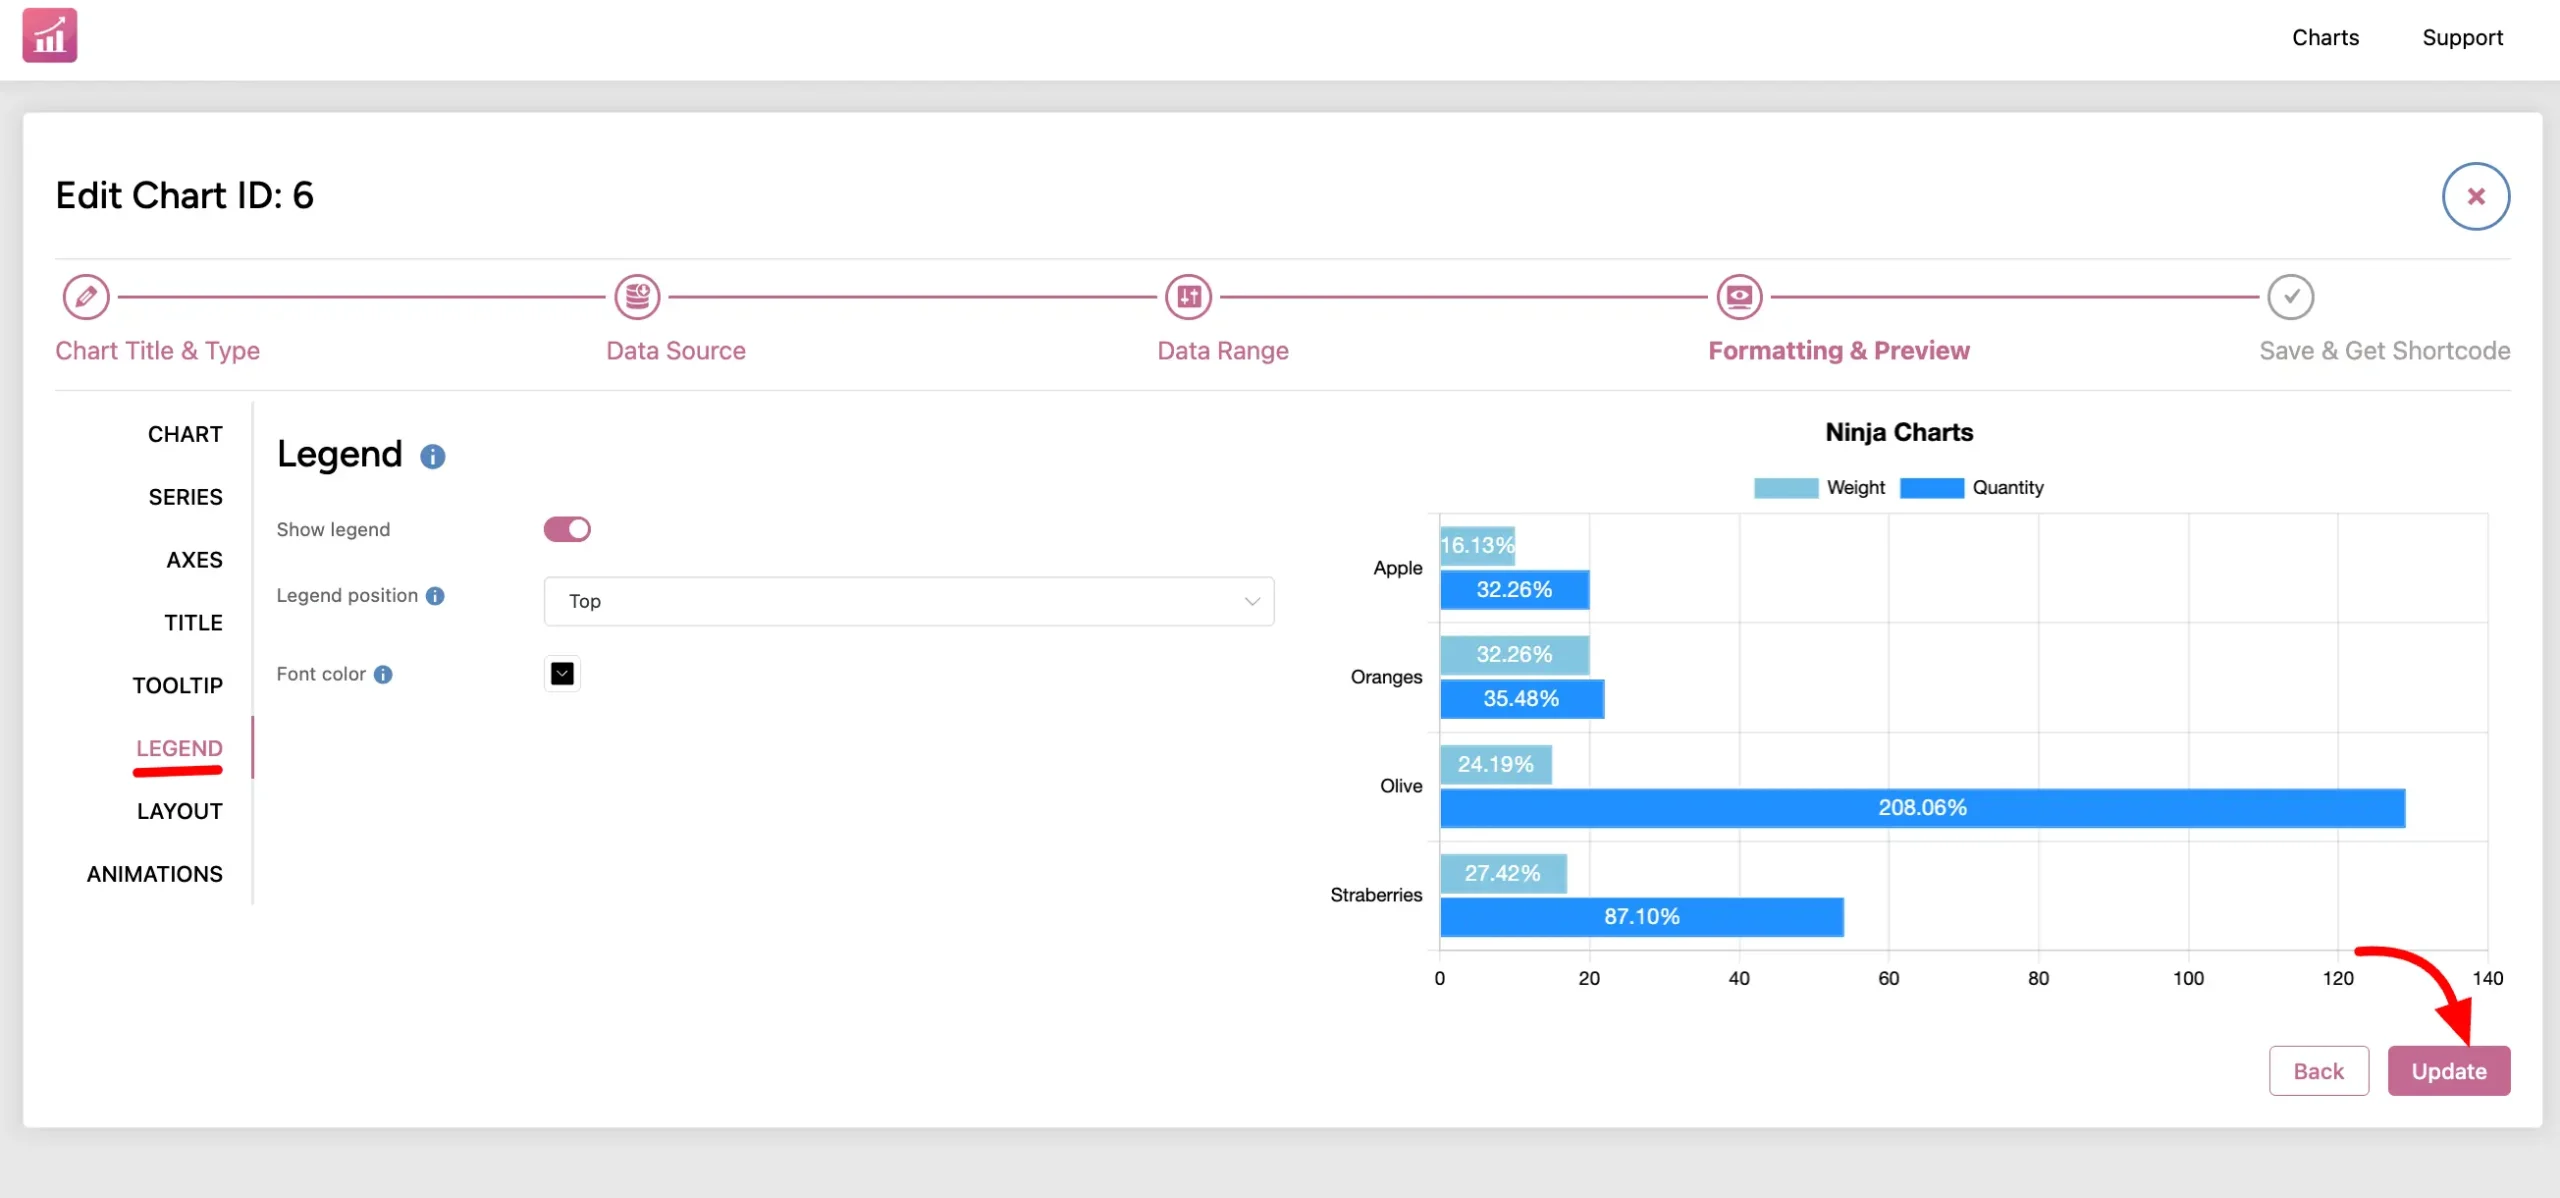
- Show legend: Enable or disable legend.
- Legend position: Position of legend- Top, Bottom, Left, Right.
- Font color: Change the legend font color.
LAYOUT #
Customize chart padding when you embed it on your website.
- Padding left
- Padding right
- Padding top
- Padding bottom
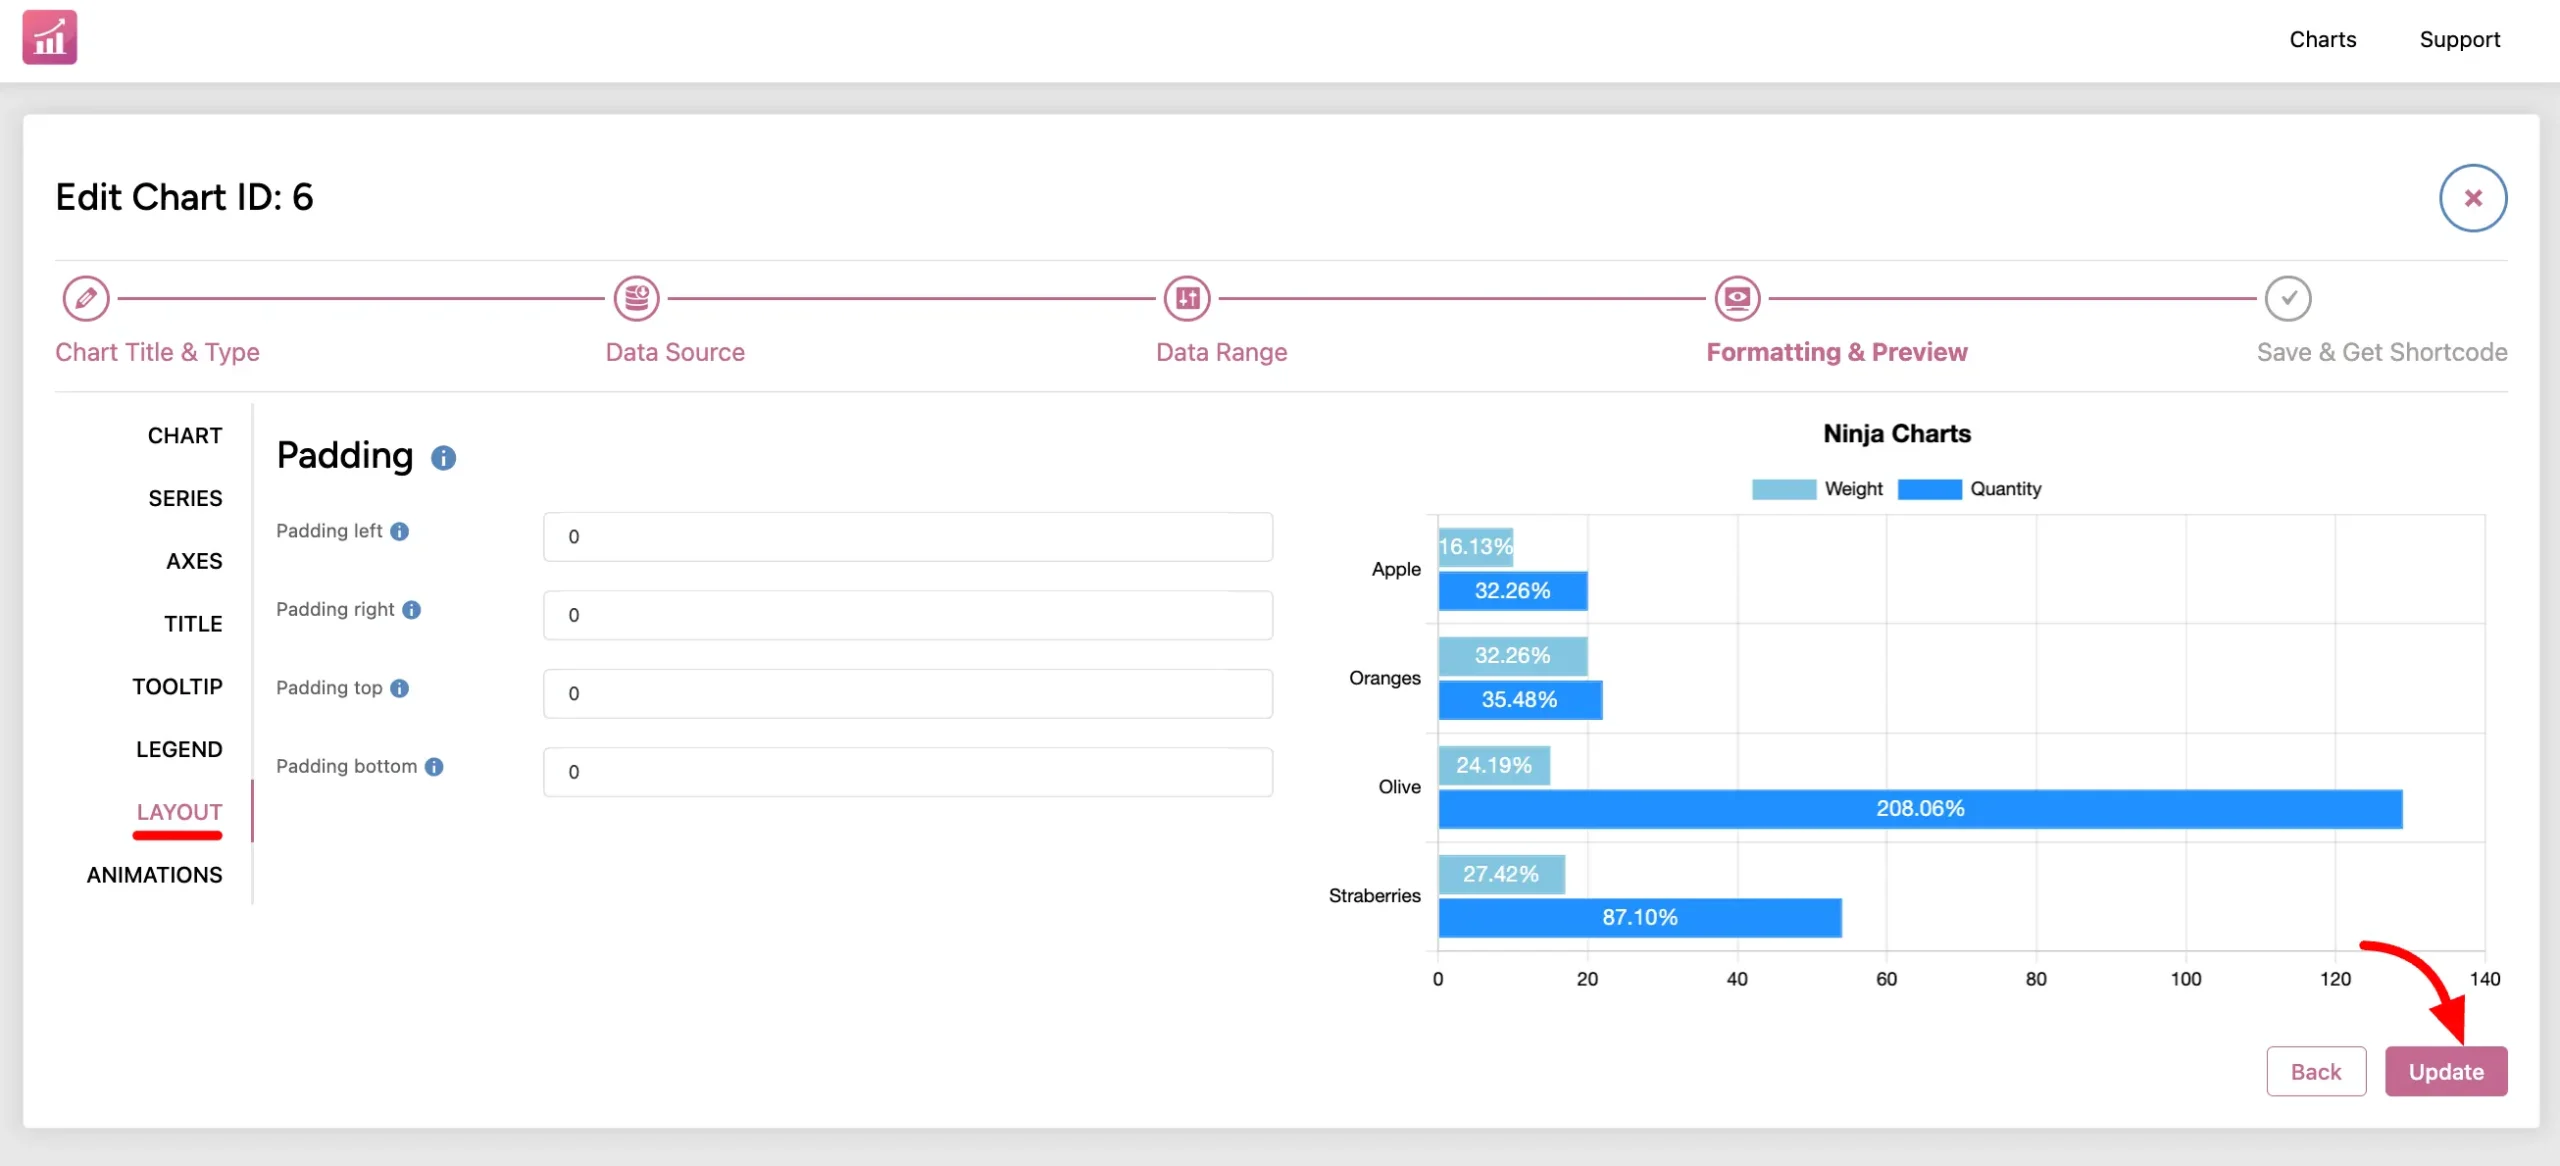
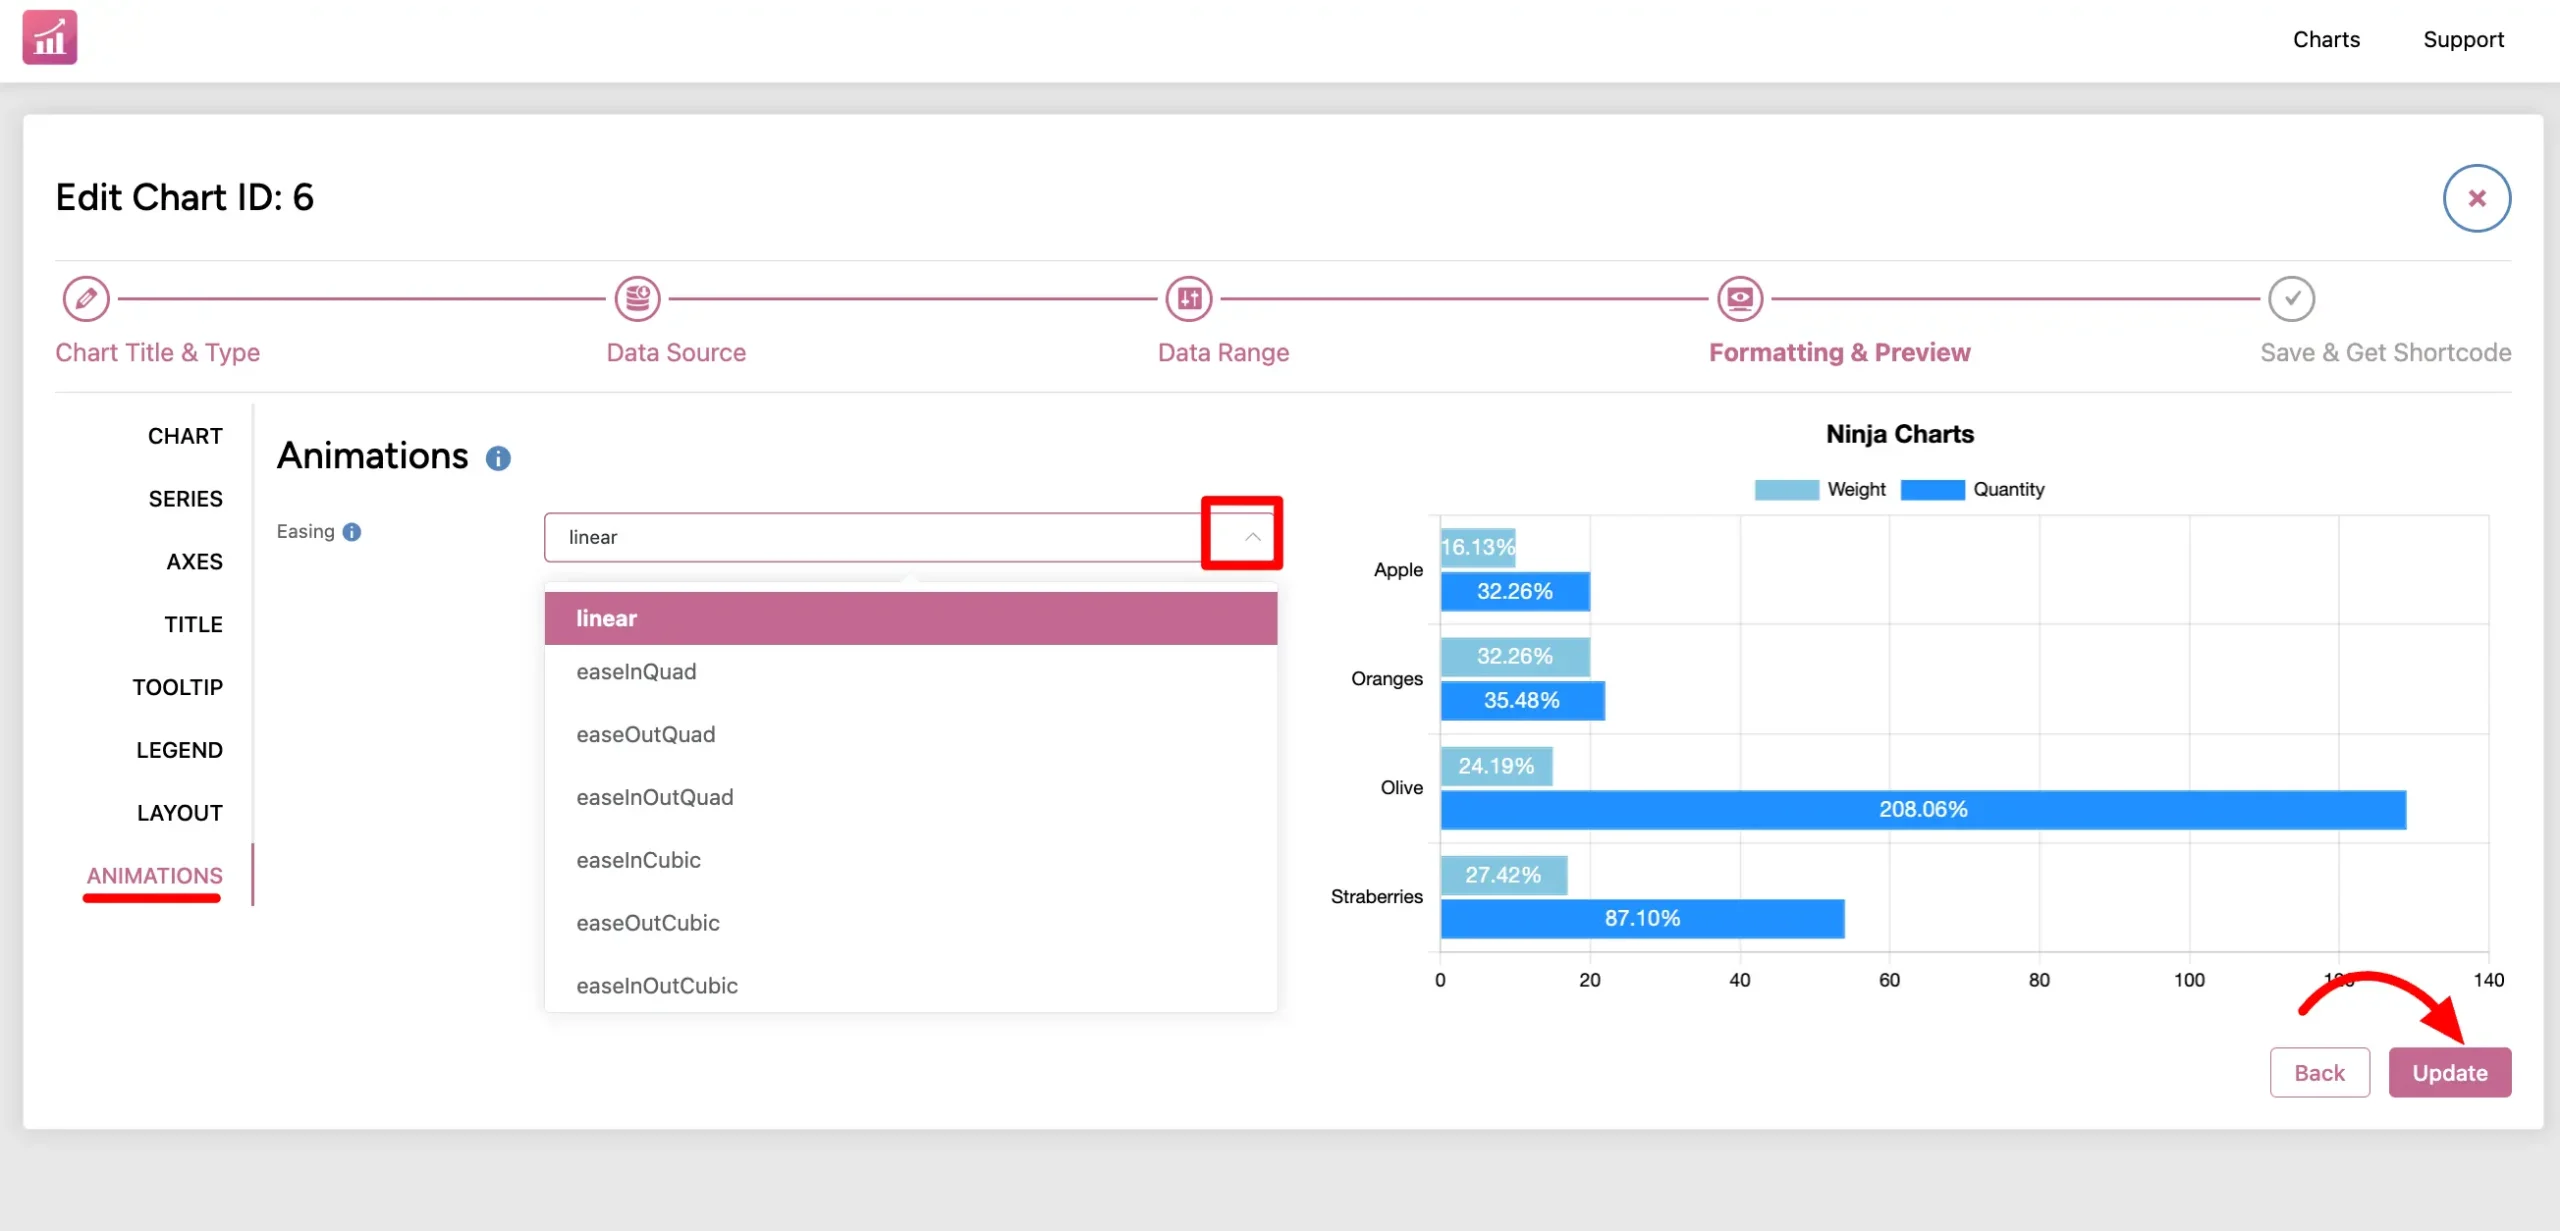
CHART ANIMATIONS #
Customize chart render animation and select the animation ease type used to render the chart provided by Chart JS.
Create customizable charts and graphs easily using Ninja Charts.


