
Ninja Charts has incredible features that generate endless online charts and graphs on your web pages. One of the great characteristics of Ninja Charts is the default functionality with Ninja Tables.
With this WordPress charts plugin, you can create dynamic charts utilizing data from the Ninja Tables plugin. You can also pull data from Fluent Forms to create charts or manually input chart entries.
Create a Chart #
Let’s have a look at the simple steps to learn how to create Ninja Charts with Ninja Tables.
***Ninja Charts is a completely free charts plugin. You can use it with or without Ninja Tables in your dashboard.
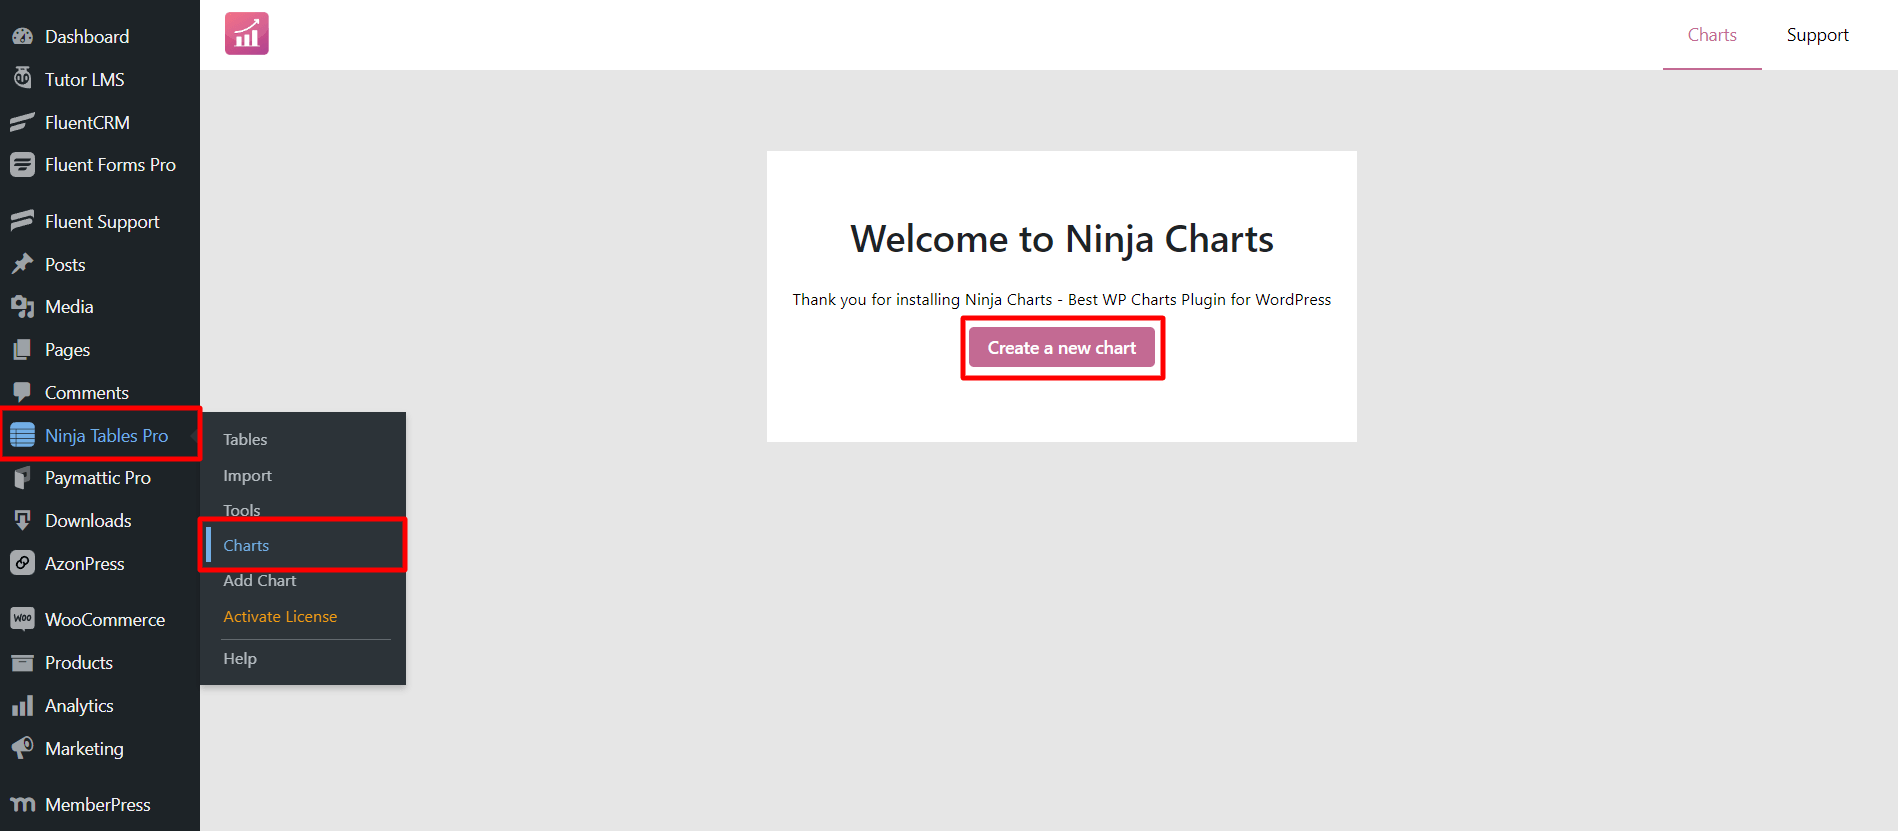
- First, go to the Ninja Tables dashboard → Add Charts → Chart List & then click on the Create a new chart button.
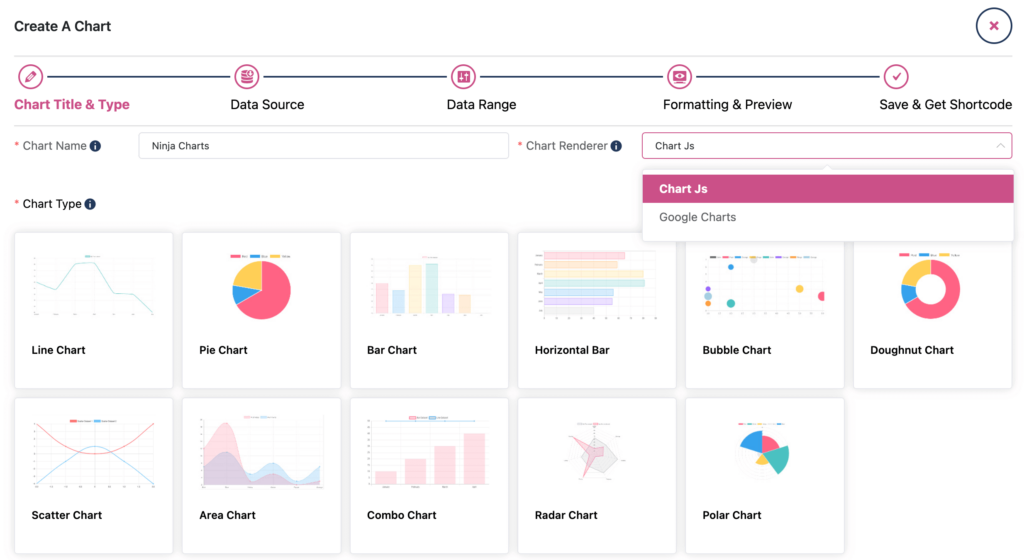
- Put your Chart Name in the title → choose a Chart to Renderer engine → select your preferred Chart Type from the dashboard → then click on the Next button.
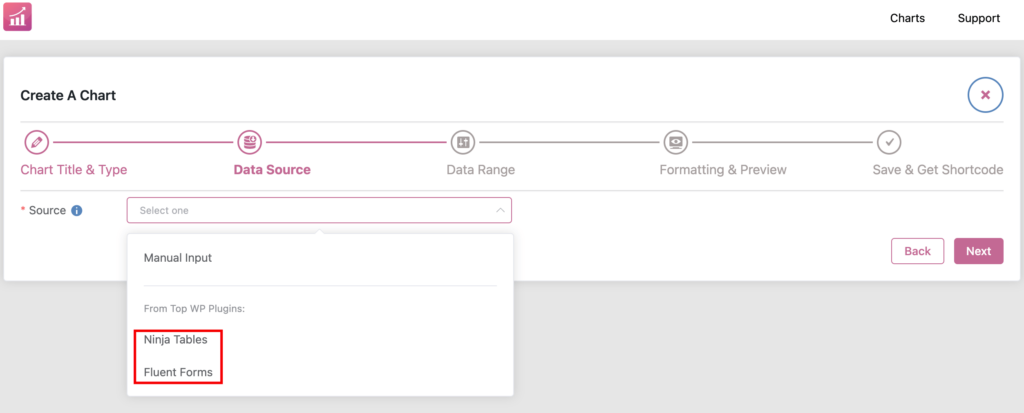
- From the Source, select Ninja Tables/Fluent Forms or Manual Input.
Choose the preferred data source (manual, forms, or tables) you want to create a chart with from the Data field. - Then click on the Next button [In this step, you will also have an option for manual chart creation]
- Then, you’ll get the option to drag & drop the desired columns and click on the Next button.
- Following that, you will see the prepared chart with Formatting & preview options. When you’ve finished making the necessary changes, click the Next button.
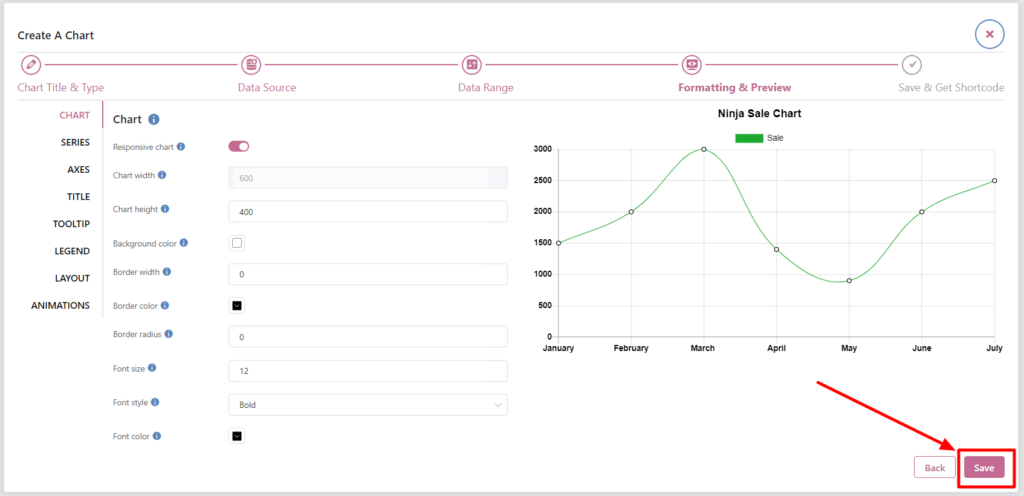
- Once you click on the Next button, you’ll move to the “Save & Get Shortcode” window. Copy the auto-generated shortcode and paste it anywhere on your website.
WordPress Charts Demo – Ninja Charts #
Pie Chart:
Line Chart:
These processes are simple and less time-consuming. As a result, you won’t find it difficult to build sophisticated or even enormous charts/graphs.


