Your website needs charts and graphs for smart data display. WordPress charts can present dynamic data in different formats like line charts, pie charts, histograms, etc.
Ninja Charts is a free WordPress chart plugin with multiple chart-creation options. You get to create visually impressive and interactive data charts with this plugin.
Just by following a few simple steps, you can generate amazing charts in different formats. The JavaScript-based chart rendering engine makes the process more accessible than ever.
And to add to its awesomeness, Ninja Charts integrates with Ninja Tables!
Why Ninja Charts? #
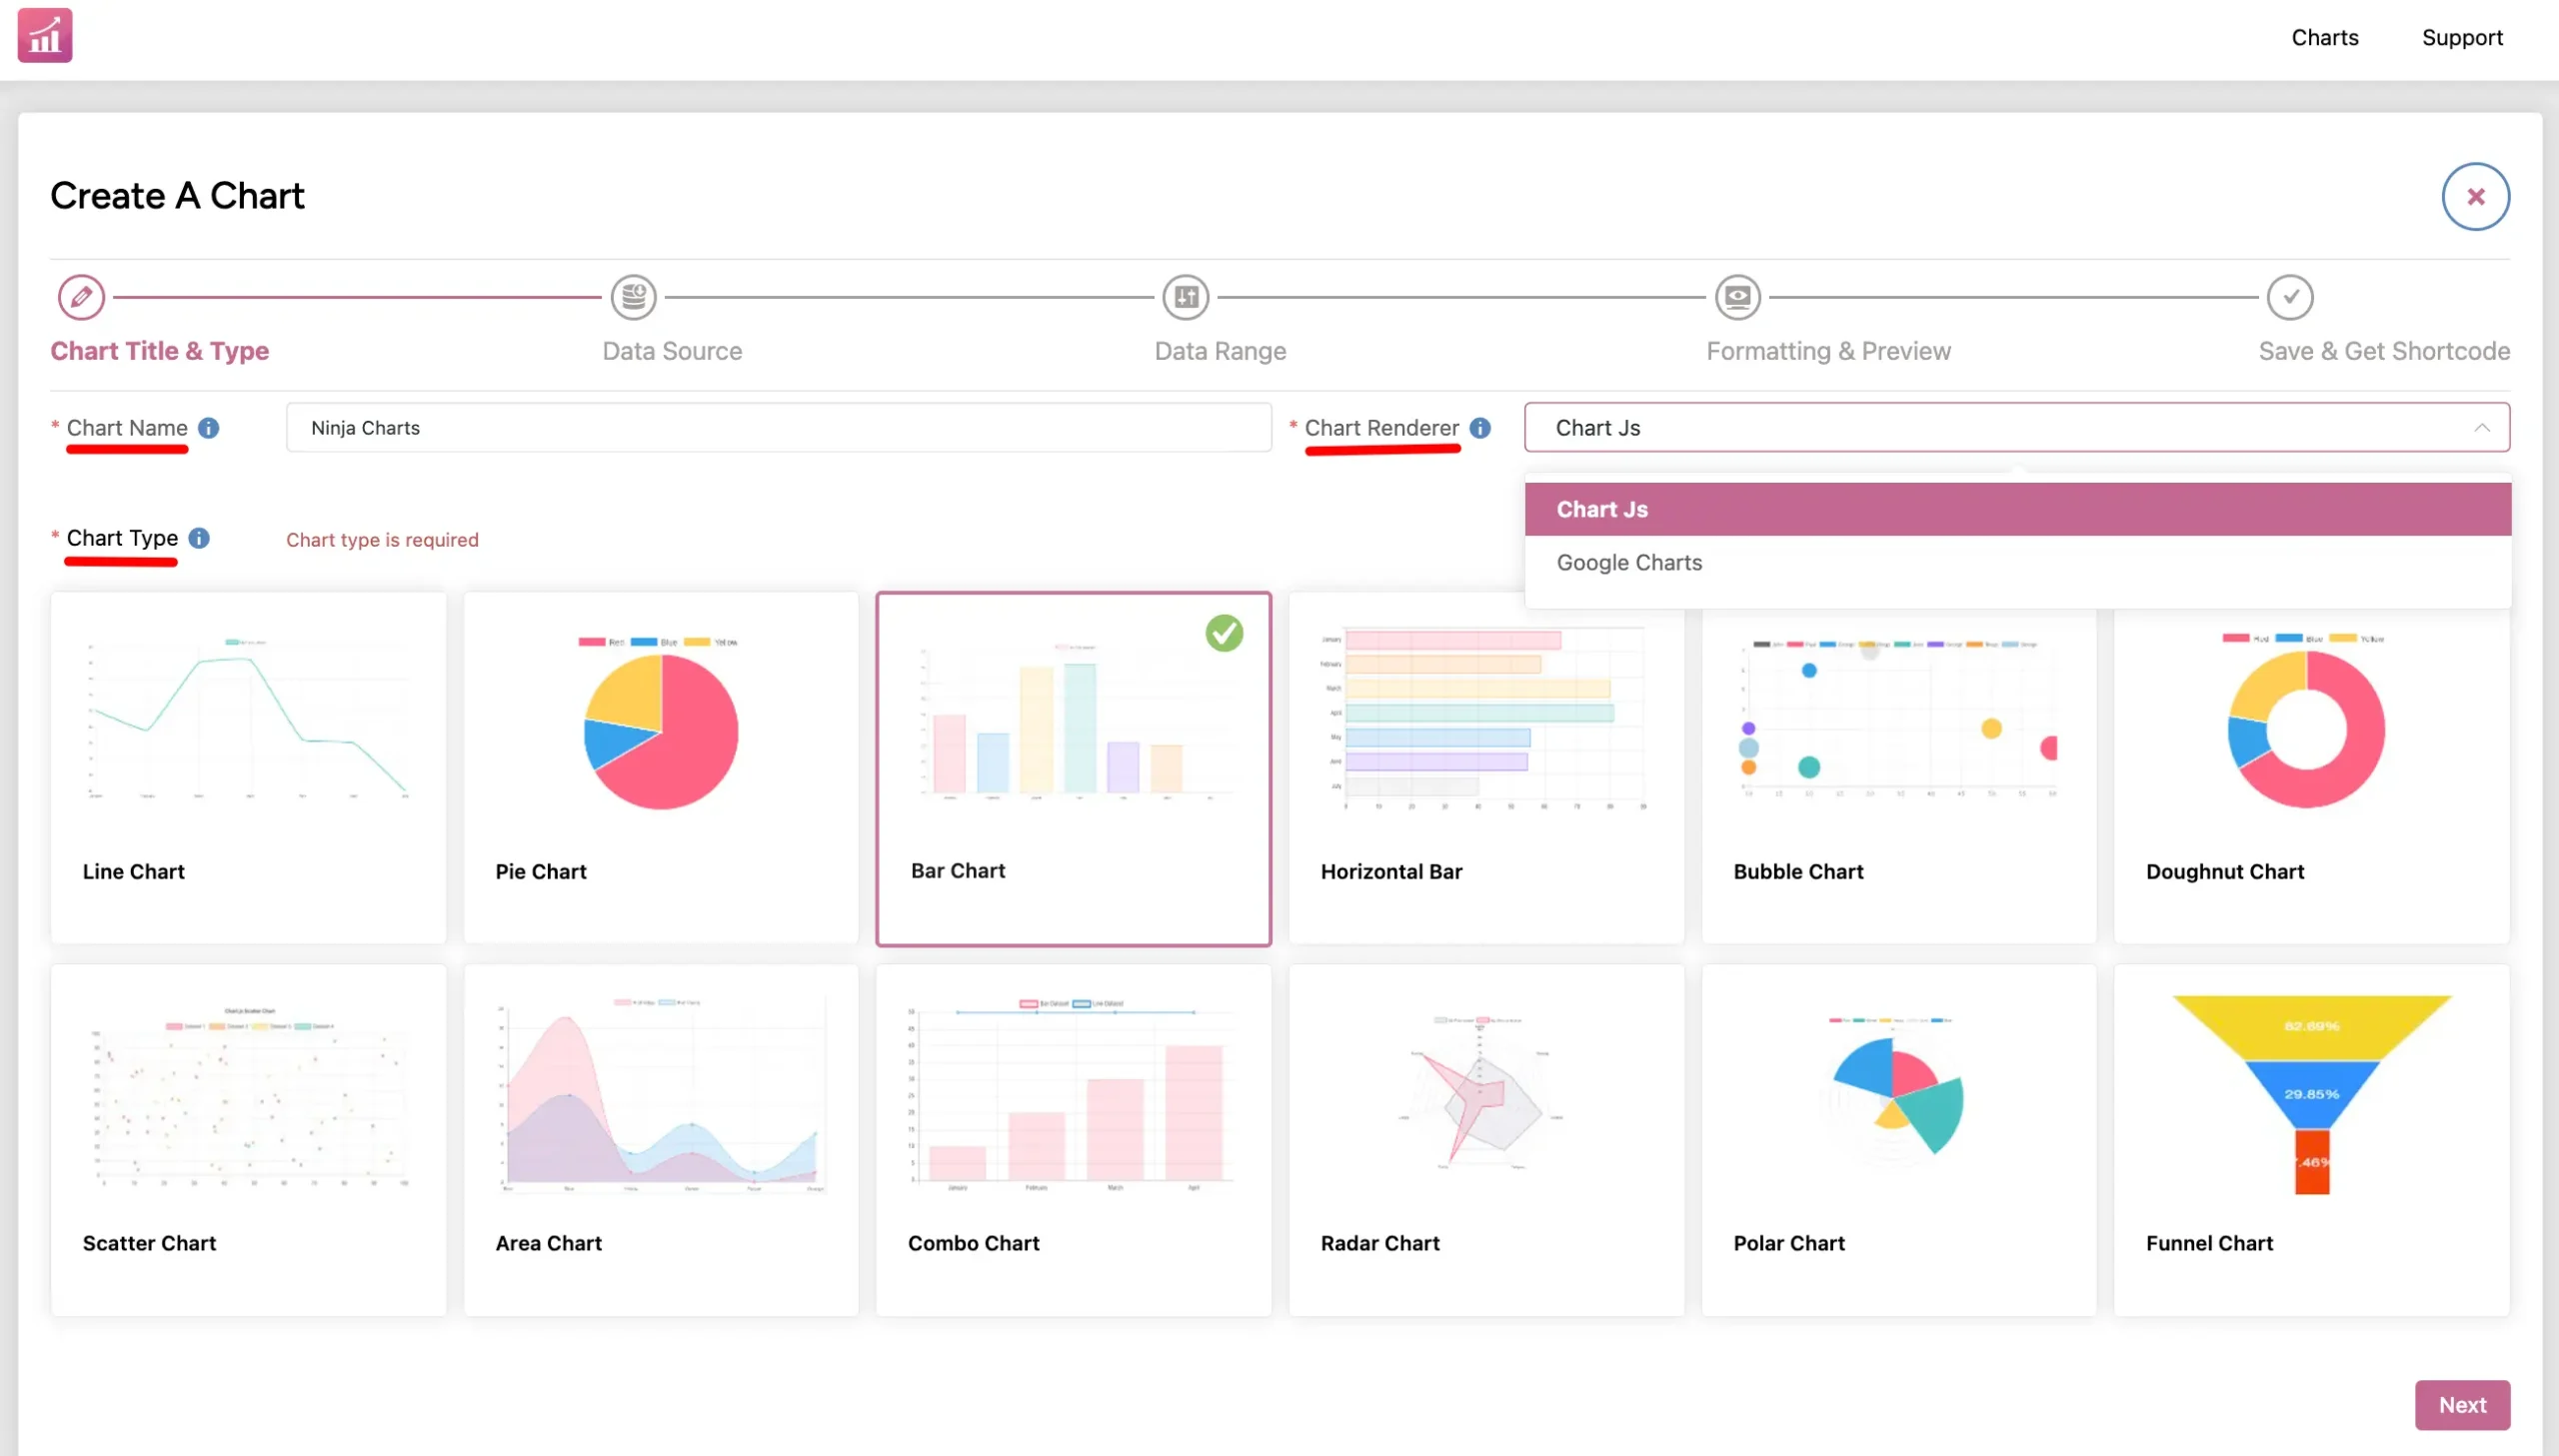
Ninja Charts is the most lightweight WordPress chart plugin that offers 10+ different styles of charts and 2 renderers- Chart JS and Google Charts. You can customize the charts however you want!

Ninja Charts includes:
- Line Chart
- Pie Chart
- Bar Chart
- Horizontal Bar
- Bubble Chart
- Doughnut Chart
- Scatter Chart
- Area Chart
- Combo Chart
- Radar Chart
- Polar Chart
One of the most notable features of Ninja Charts is its ability to pull data from Ninja Tables and Fluent Forms to create beautiful dynamic charts.
You can also create charts with manual data input.
Ninja Charts Features #
As a free charts visualization tool Ninja Charts enables you to create many kinds of customizable charts and graphs.
Here are some features of Ninja Charts:
- Integration with Ninja Tables
- Easy-to-use interface
- Multiple chart types
- Design and Layout customization
- Responsive and mobile-friendly
- SEO-friendly charts
- Shortcodes to embed
- Live preview on admin panel
- Versatile rendering engines
How to Use #
Simply install and activate Ninja Charts and hit Add New.
It’s a simple 5-step process-
- Chart Title & Type: Name the chart and select a type from 10+ chart types.
- Data Source: Choose whether to create a manual chart or fetch from Ninja Tables/Fluent Forms.
- Data Range: Select the data amount and data order.
- Formatting & Preview: Customize the chart color, text, animation, etc.
- Save & Get Shortcode: Copy the auto-generated shortcode and paste it anywhere.
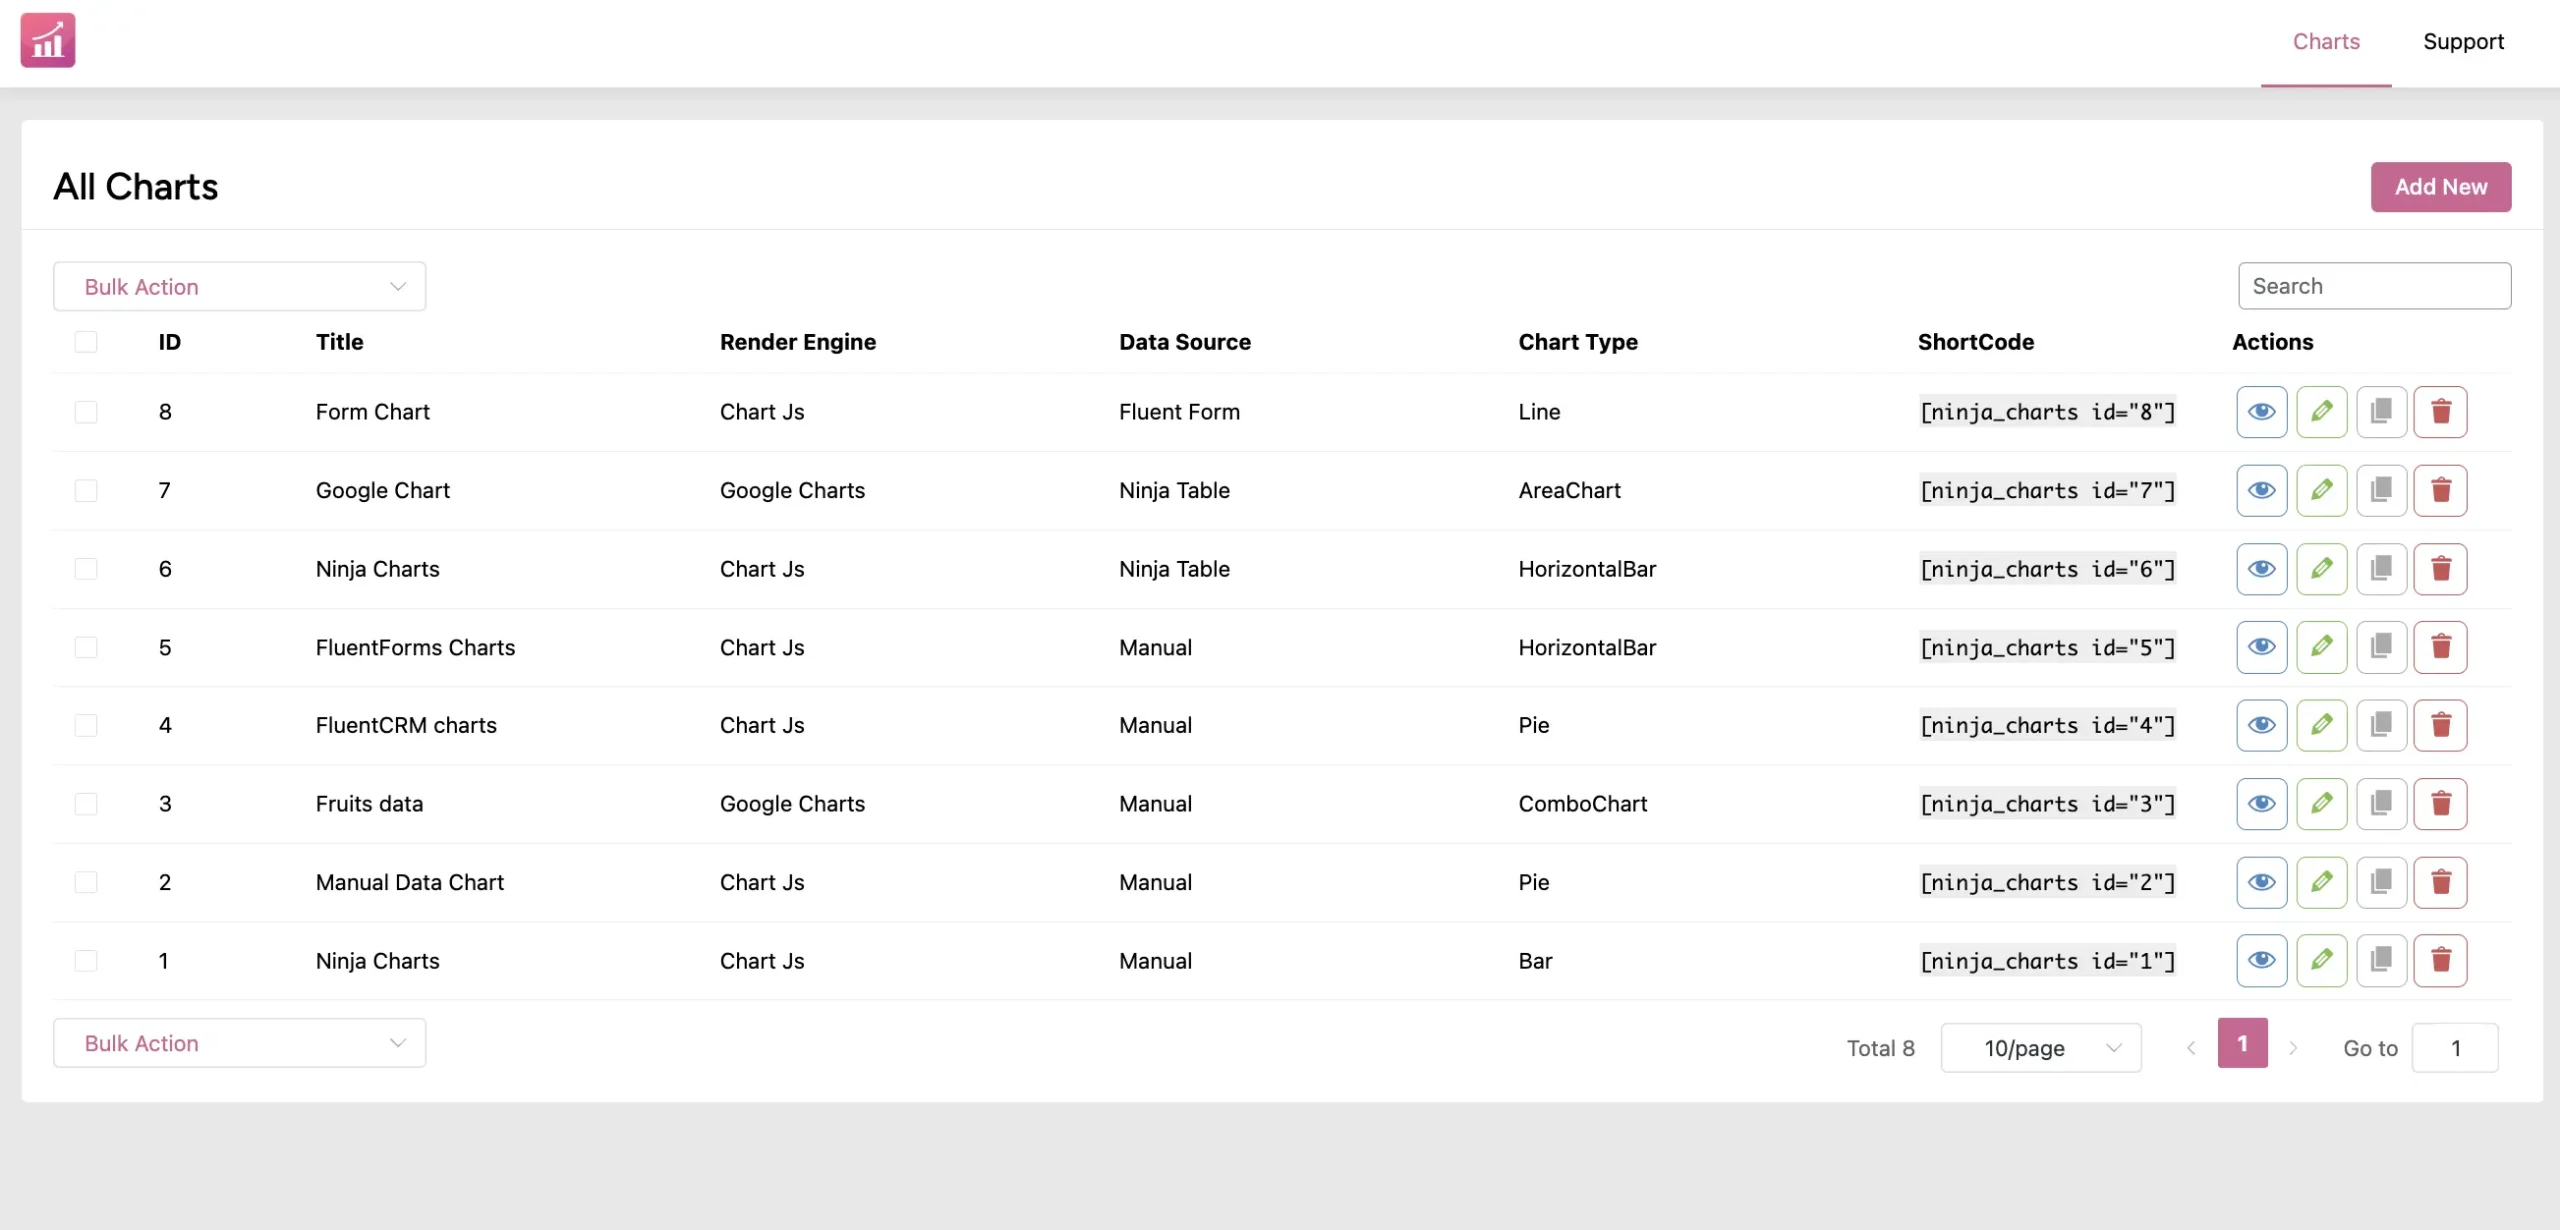
Here are the charts created in the Ninja Charts dashboard.

If you’re looking for tools to display data in WordPress charts, Ninja Charts is for you.


