If you have a data table created with Ninja Tables ready to go, you can turn those table data into a chart using Ninja Charts! Since it’s a free integration, you only need the 2 plugins in your dashboard to create a chart with table data.
We’ll show you how.
Create Charts with Ninja Tables Data #
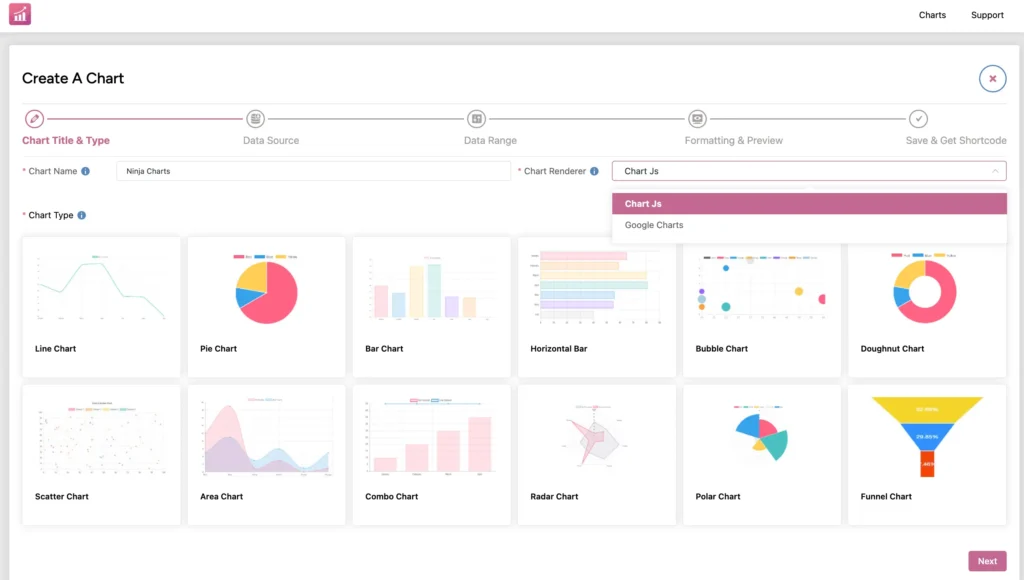
As usual, start by selecting chart renderer (Charts Js or Google Charts) in Ninja Charts. Then if you have a prefered chart type, select it from the 10+ options.
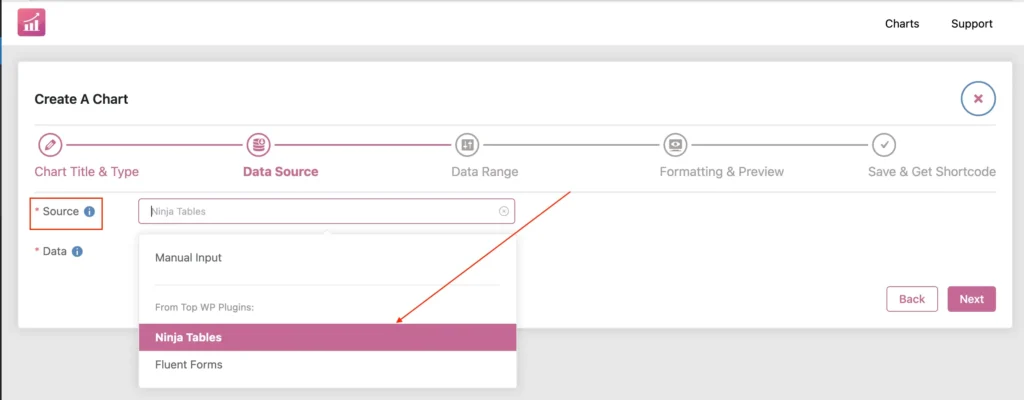
Select Ninja Tables as Chart Data Source #
Just like the usual data source layout, you can see 3 data source options to create your chart.
-Manual Input: Users can input their own data manually
-Ninja Tables: Create chart using a table
-Fluent Forms: Create chart using form entries
We’ll select Ninja Tables as the chart data source.
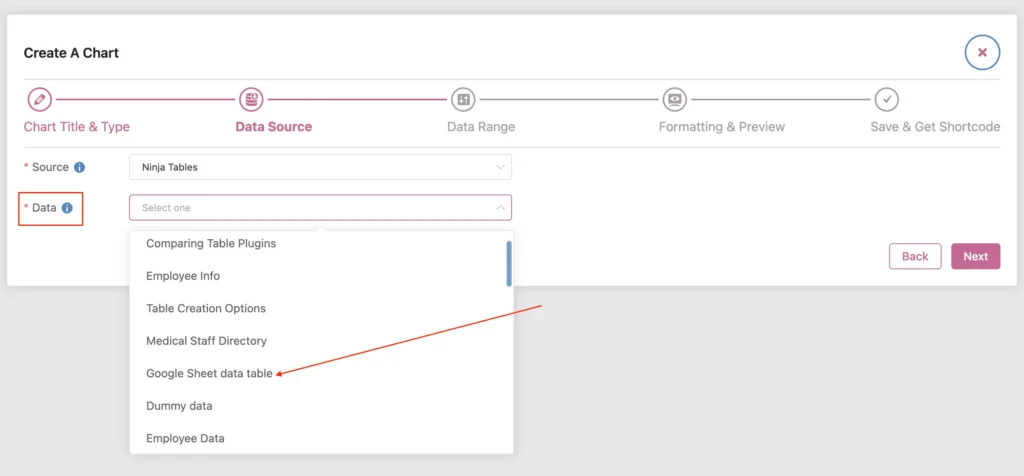
Once you select the source, you can select the table data you want to turn into a chart.
Pick a table and populate your chart.
You can now hit “Next” and customize your chart as you want.
Tip: Tables with text input are not suitable for charts like pie chart or radar. For Ninja Charts to correctly populate table entries, you need to pick the correct table and the correct chart type. Duplicate text type or invalid data type cannot create a chart.


