Actionable Data Table Design Tips for Better Conversions

Your tables are quietly killing your conversions.
Every day, visitors land on your WordPress site, scan through your carefully organized data, and leave without taking action. They’re not bouncing because your content is bad—they’re leaving because your tables UI design makes everything harder than it needs to be.
Whether you’re displaying product specifications, comparing service plans, showing employee directories, or listing event schedules, tables are everywhere on your websites. They’re not just data containers; they’re decision-making tools that either guide visitors toward action or send them running to competitors.
Here are 9 proven strategies for designing table layouts the right way. Each one you can implement instantly with Ninja Tables to boost your conversion rates.
How Table UI Design Helps Your Business
Numbers are scary. We all struggle with data, numbers, and boring table layouts, to some extent.
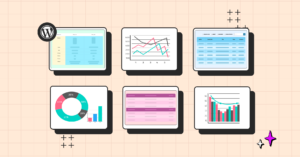
Now, imagine the daily grind for those whose work revolves around these. It’s no easy ride. That’s why WordPress table plugins that simplify data presentation, make it clear, organized, and visually appealing, can be game-changers.
Here’s what most people miss: tables are often the last thing someone sees before they buy, sign up, or contact you. That moment isn’t just visual—it’s cognitive. A thoughtfully structured table highlights what matters, removes friction, and gives users the confidence to take action, not by pushing, but by informing.
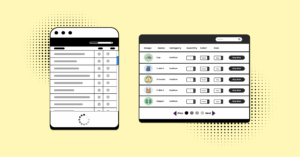
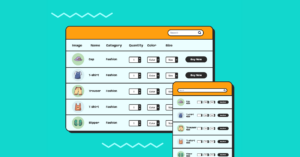
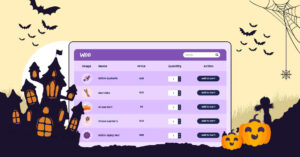
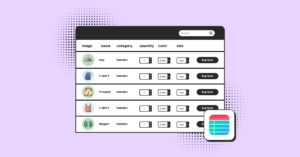
| Image | Name | Category | Price | Quantity | Buy |
|---|---|---|---|---|---|
 | Beach essentials | Summer | Original price was: $50.00.$38.00Current price is: $38.00. | | |
 | Beach slippers | Summer | $15.00 | | |
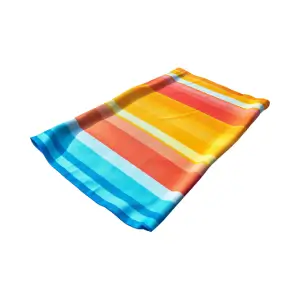 | Beach towel | Summer | $33.00 | | |
 | Beach hats | Summer | $28.00 | |
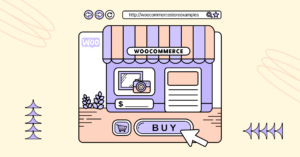
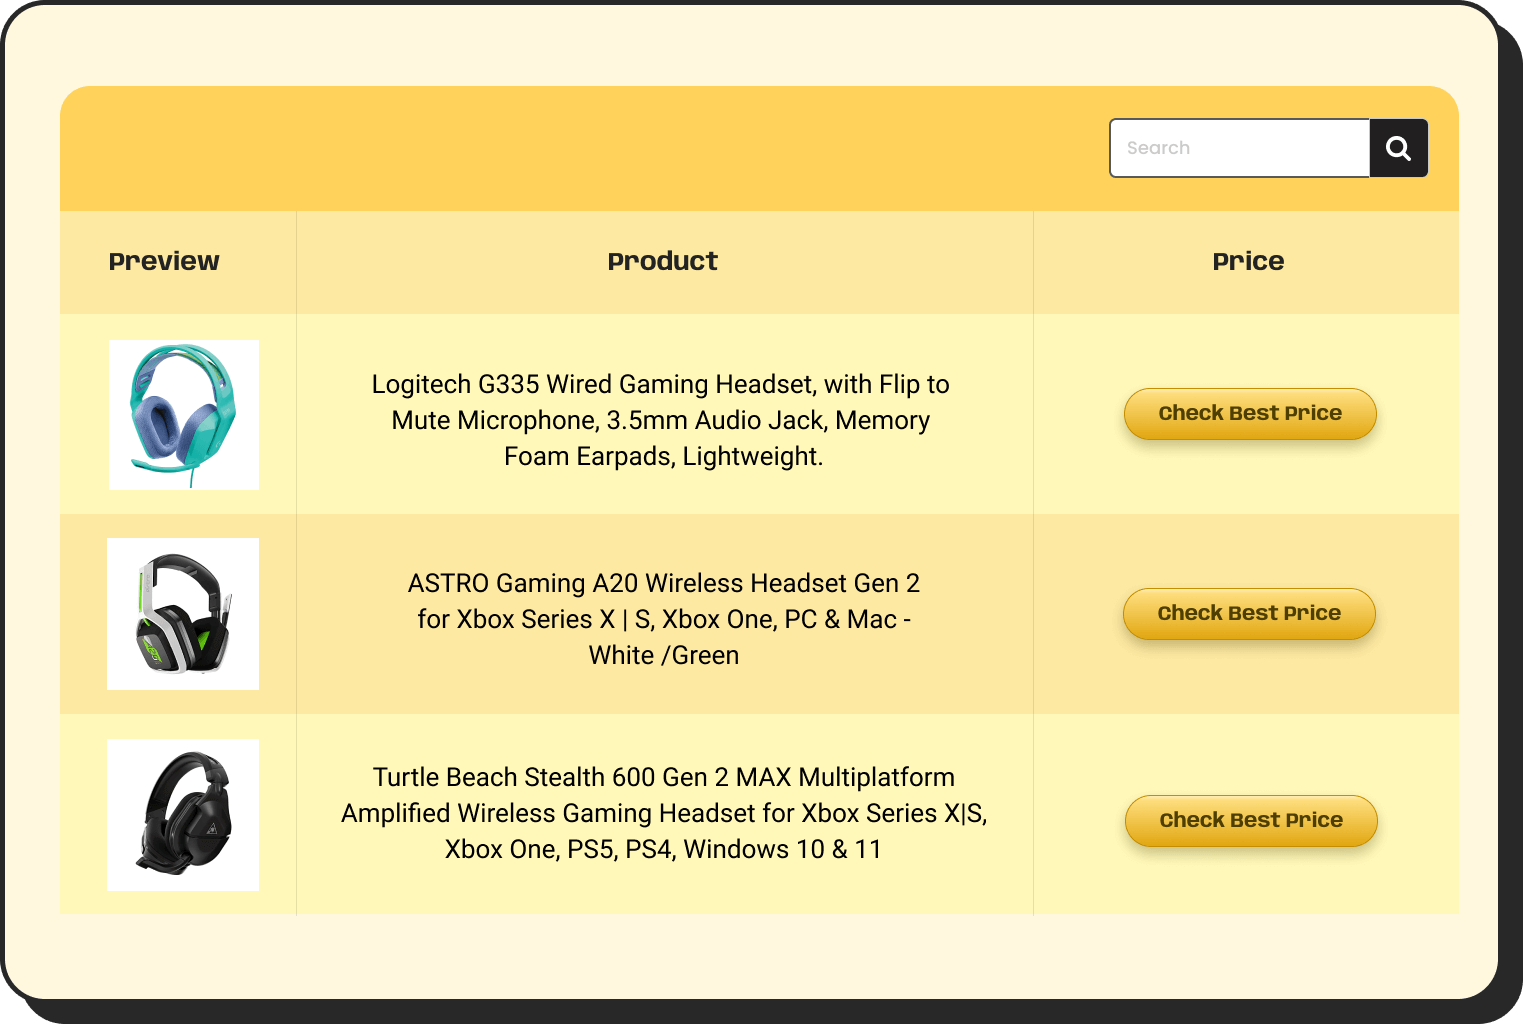
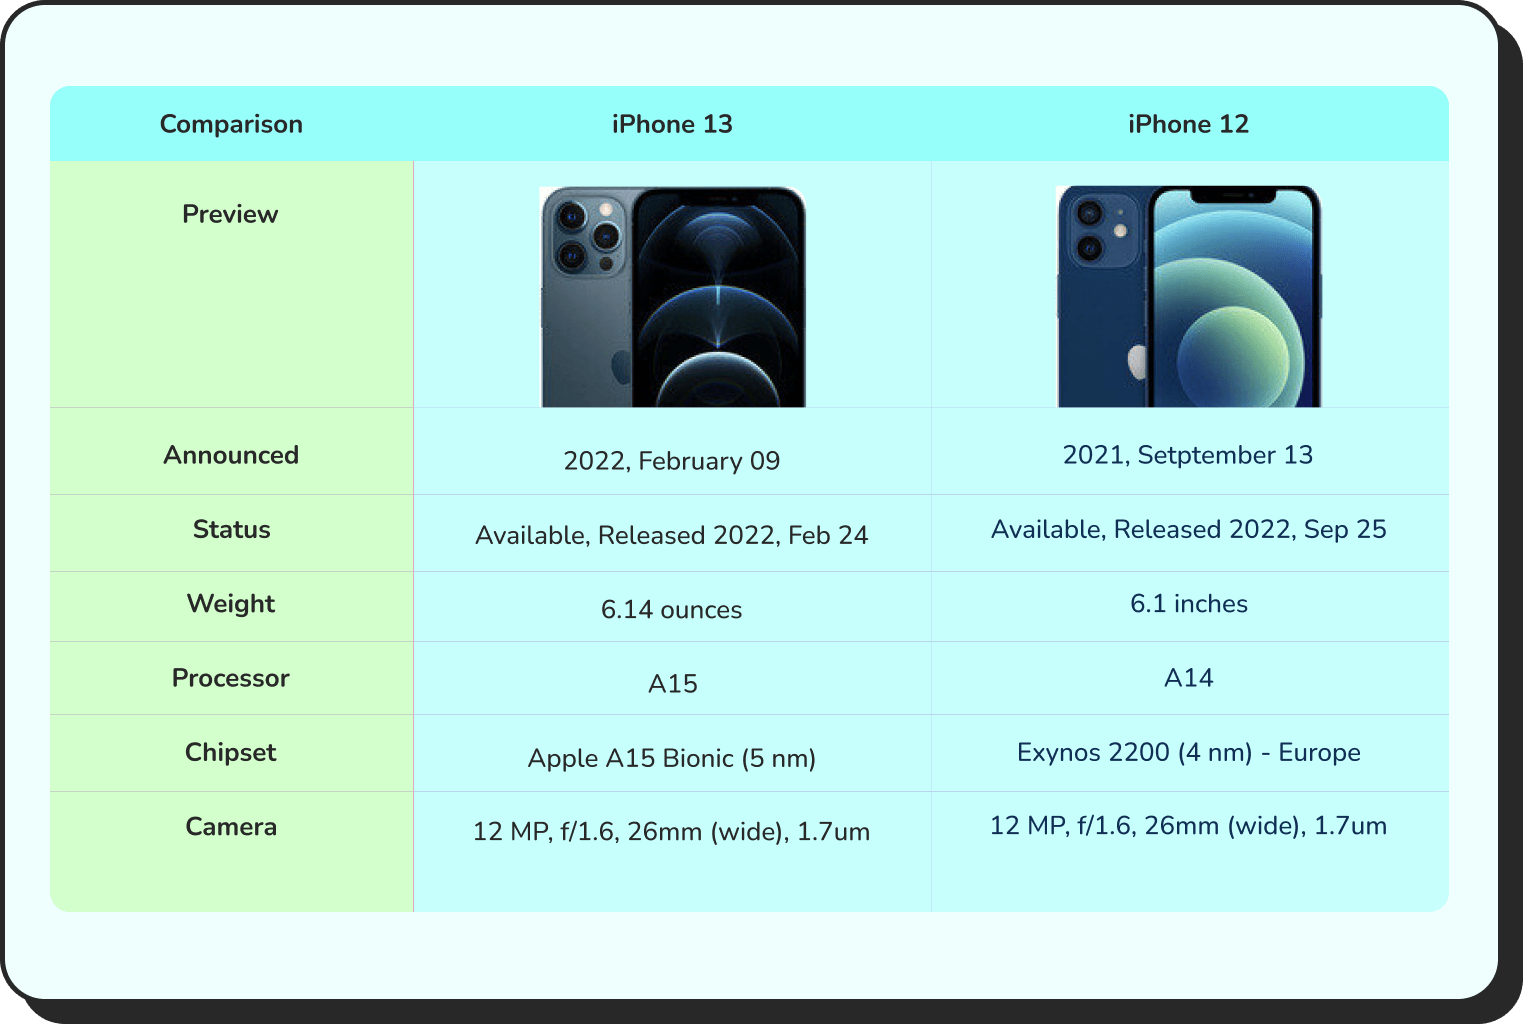
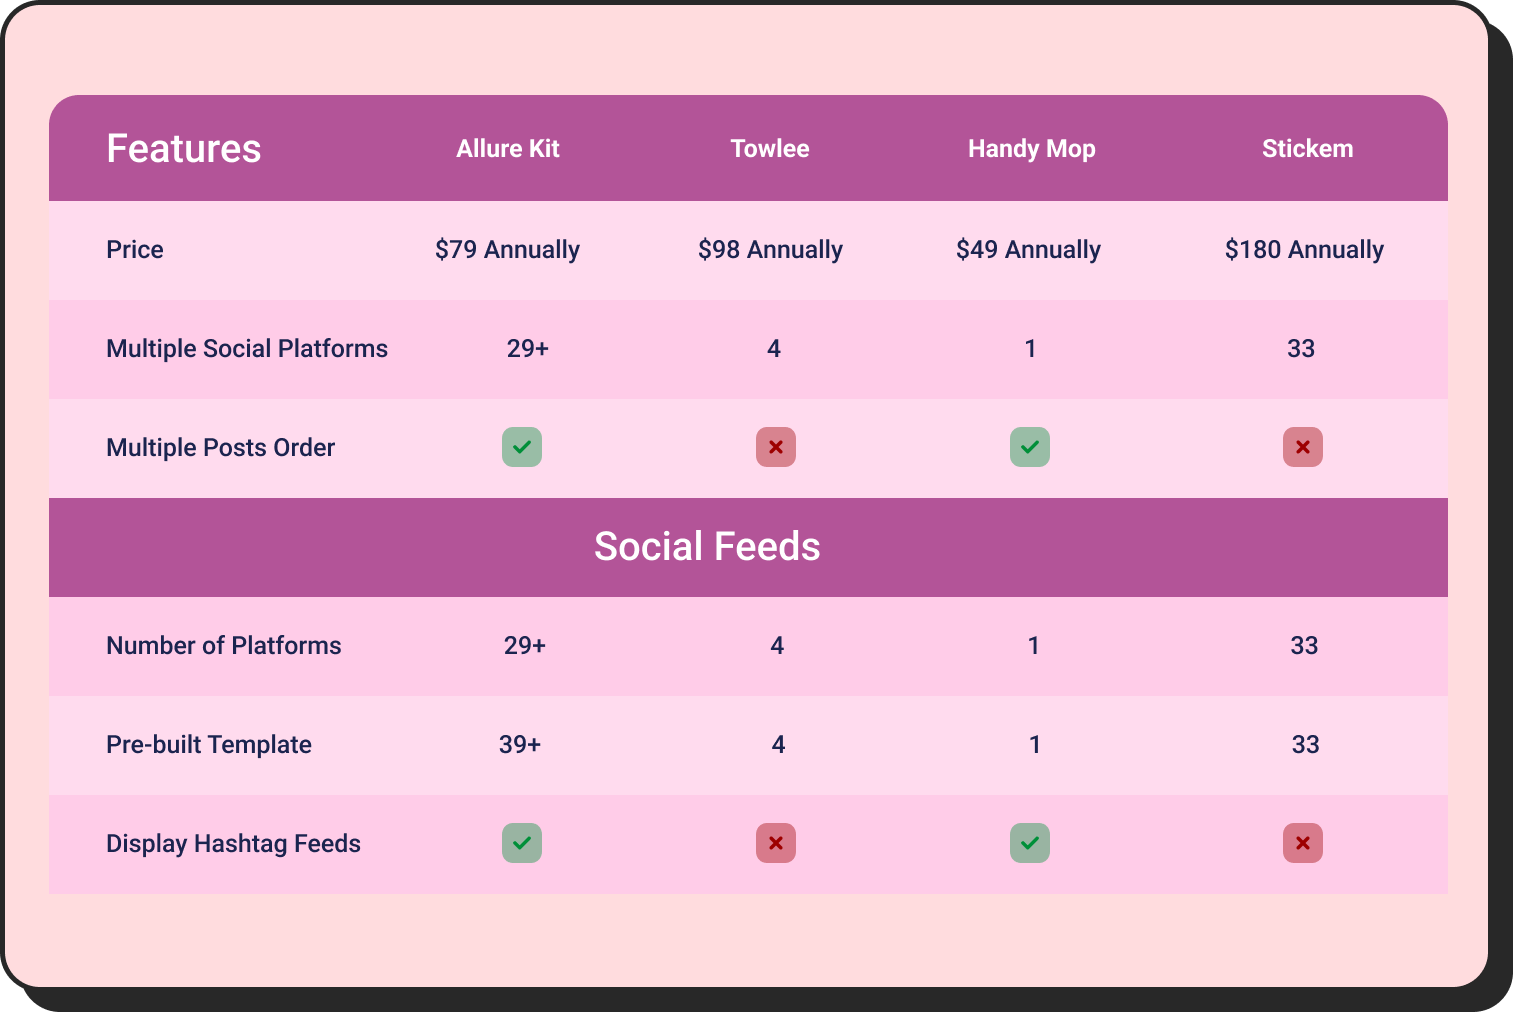
That product comparison table? It’s where they decide if your product is worth the money. Or even to choose between products in a similar category.
| Faetures | K-Elite | K-Duo | K-Duo Plus |
|---|---|---|---|
| Keurig image | 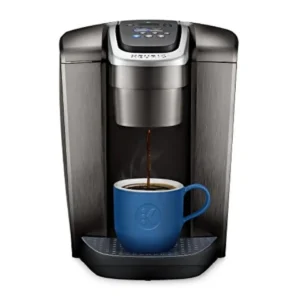 |  | 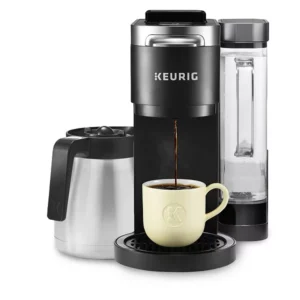 |
| Brew Sizes | 6, 8, 10, 12 oz | 6, 8, 10, 12 oz | 6, 8, 10, 12 oz |
| Strength Control | ✅ | ✅ | ✅ |
| Energy Saver | ✅ | ✅ | ✅ |
| Water Reservoir | 75 oz | Removable-60 oz | Removable- 60 oz multi-position |
| Drip Coffee | ❌ | ✅ | ✅ |
| Iced Setting | ✅ | ❌ | ❌ |
| Programmable Carafe Auto Brew | ❌ | ✅ | ✅ |
| Carafe Type/Heating Plate | ❌ | Glass carafe & heating plate | Stainless Steel thermal carafe |
| Box Includes | Water filter handle, water filter | Glass carafe | Stainless Steel thermal carafe, gold tone mesh filter |
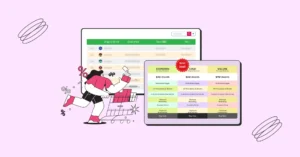
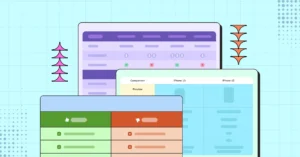
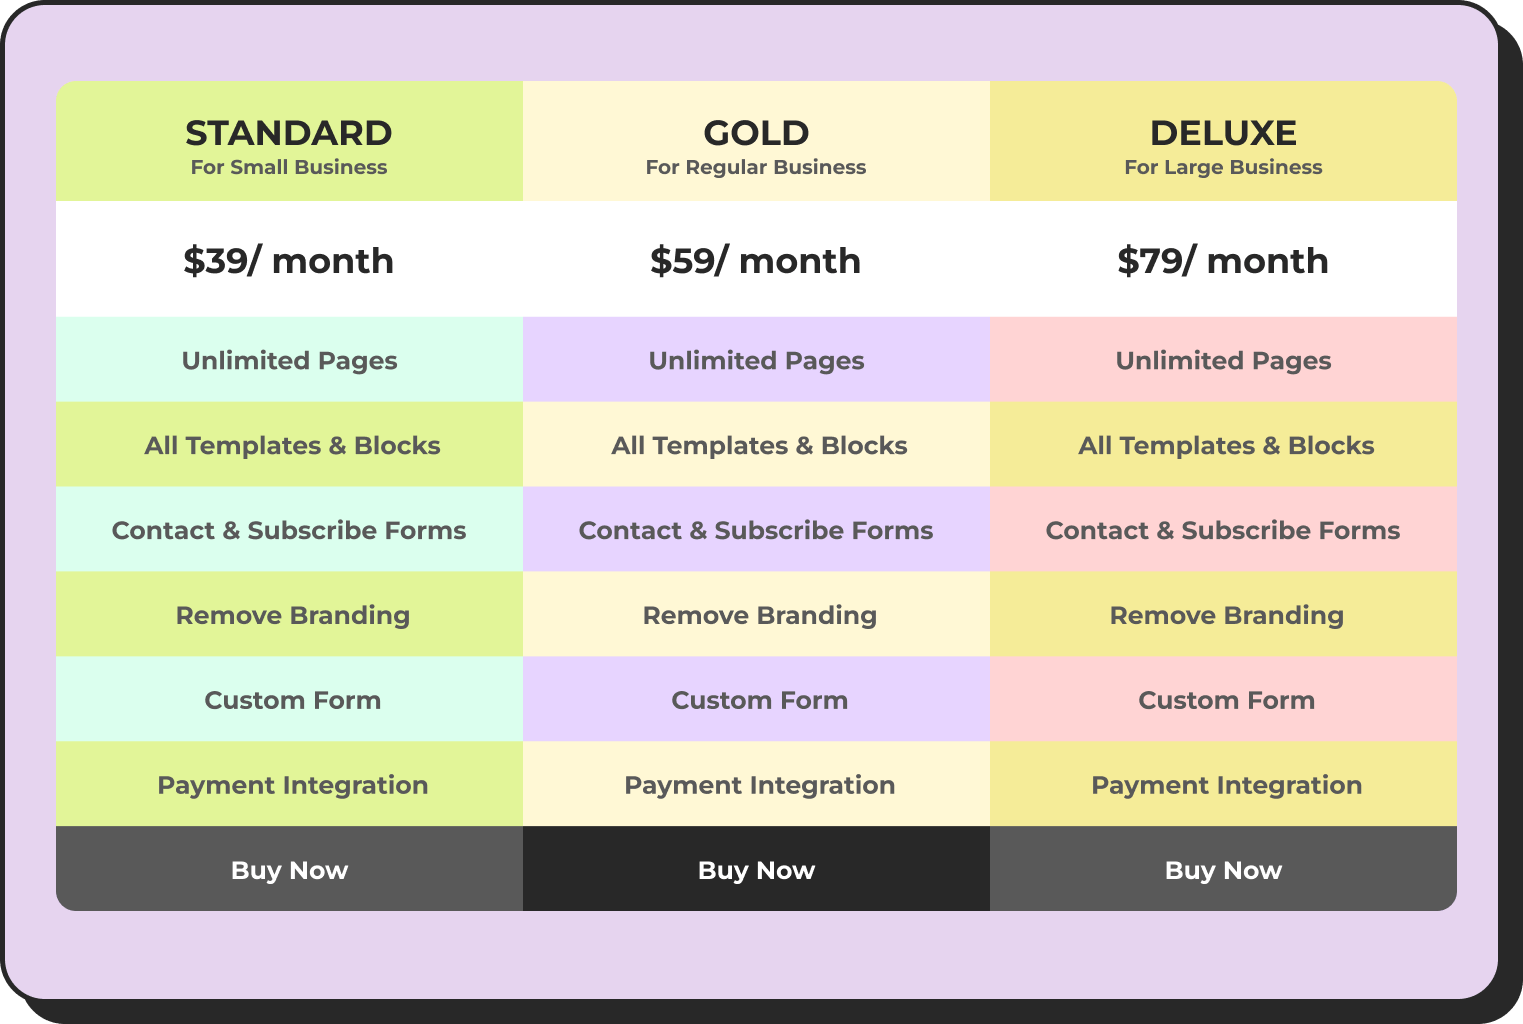
That pricing grid? It’s where they choose between the basic and premium plans. It comes in handy for digital products or service-based companies.
Single Site License 1 Domain License | Agency License 5 Domain License
| 50 Sites License 50 Domain License
|
$129 | $249 | $399 |
Annual License | Annual License | Annual License |
10 Business Email Piping | 50 Business Email Piping | 500 Business Email Piping |
Unlimited Email Parsing | Unlimited Email Parsing | Unlimited Email Parsing |
1 Year Plugin Update | 1 Year Plugin Update | 1 Year Plugin Update |
1 Year Priority Support | 1 Year Priority Support | 1 Year Priority Support |
All Features Included | All Features Included | All Features Included |
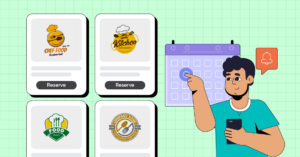
That restaurant menu layout? It’s what makes them call for a reservation or order takeout. Unusual right? But not impossible with just a single plugin.
| 1 | 2 | 3 |
|---|---|---|
 |  |  |
| Hot Grills Point - Yum! ★★★★★ (299 Reviews) Get Hot Grills & Spice Any Day! Book Your Table: Now Booking Open: 9:00 Booking Ends: 18:00 | Sweets & Stuff - Desserts ★★★★★ (99 Reviews) Get Hot Grills & Spice Any Day! Book Your Table: Now Booking Open: 9:00 Booking Ends: 18:00 | Food On FIRE - Spicy ★★★★★ (199 Reviews) Get Hot Grills & Spice Any Day! Book Your Table: Now Booking Open: 9:00 Booking Ends: 18:00 |
 |  |  |
| Good Food Day - Bistro ★★★★★ (1000 Reviews) Start a good day with good food. Reservation: On Spot Opens: 8:00
Closes: 21:00 | Oenophile - Wine Tasting ★★★★★ (999 Reviews) Visit for a fun ride with fun wines. Reserve: Open Opens: 16:00
Closes: 21:30 | Chef's Den - Food Hub ★★★★★ (499 Reviews) Best for food all over the world! Reserve: Now |
Creating this doesn’t require a PhD in design or a developer on standby. In many cases, small, deliberate improvements like better spacing, consistent color contrast, clearer call-to-actions, embedded media, or useful links can improve how users interact with your product tables. These few tweaks may seem minor, but together, they simplify decision-making and build brand image. Done right, they’ll give your competitors a real run for their money.
What to Consider Before Table UX Design
Before you install another table plugin or start coding custom solutions, take a step back and ask yourself these questions:
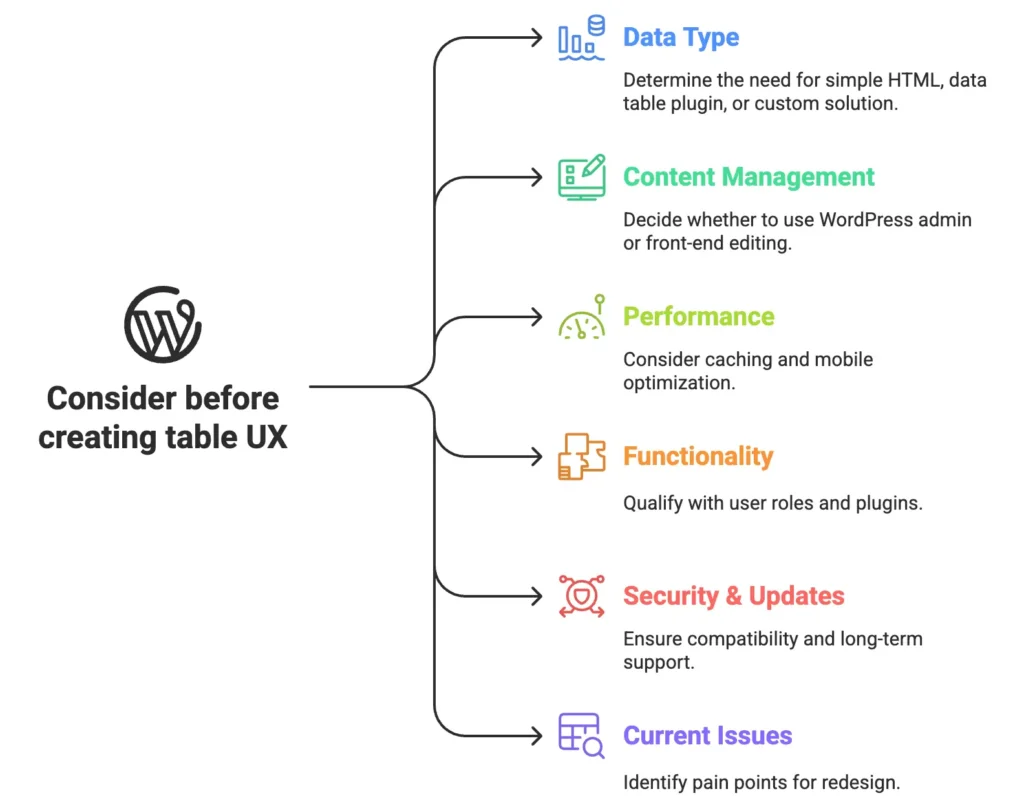
What kind of data are you working with?
Are you building for a membership site, WooCommerce store, custom post types, user info, or plugin data? This determines whether you need a simple HTML table, a WordPress data table plugin, or a custom solution that hooks into WordPress APIs.
What’s your content management strategy?
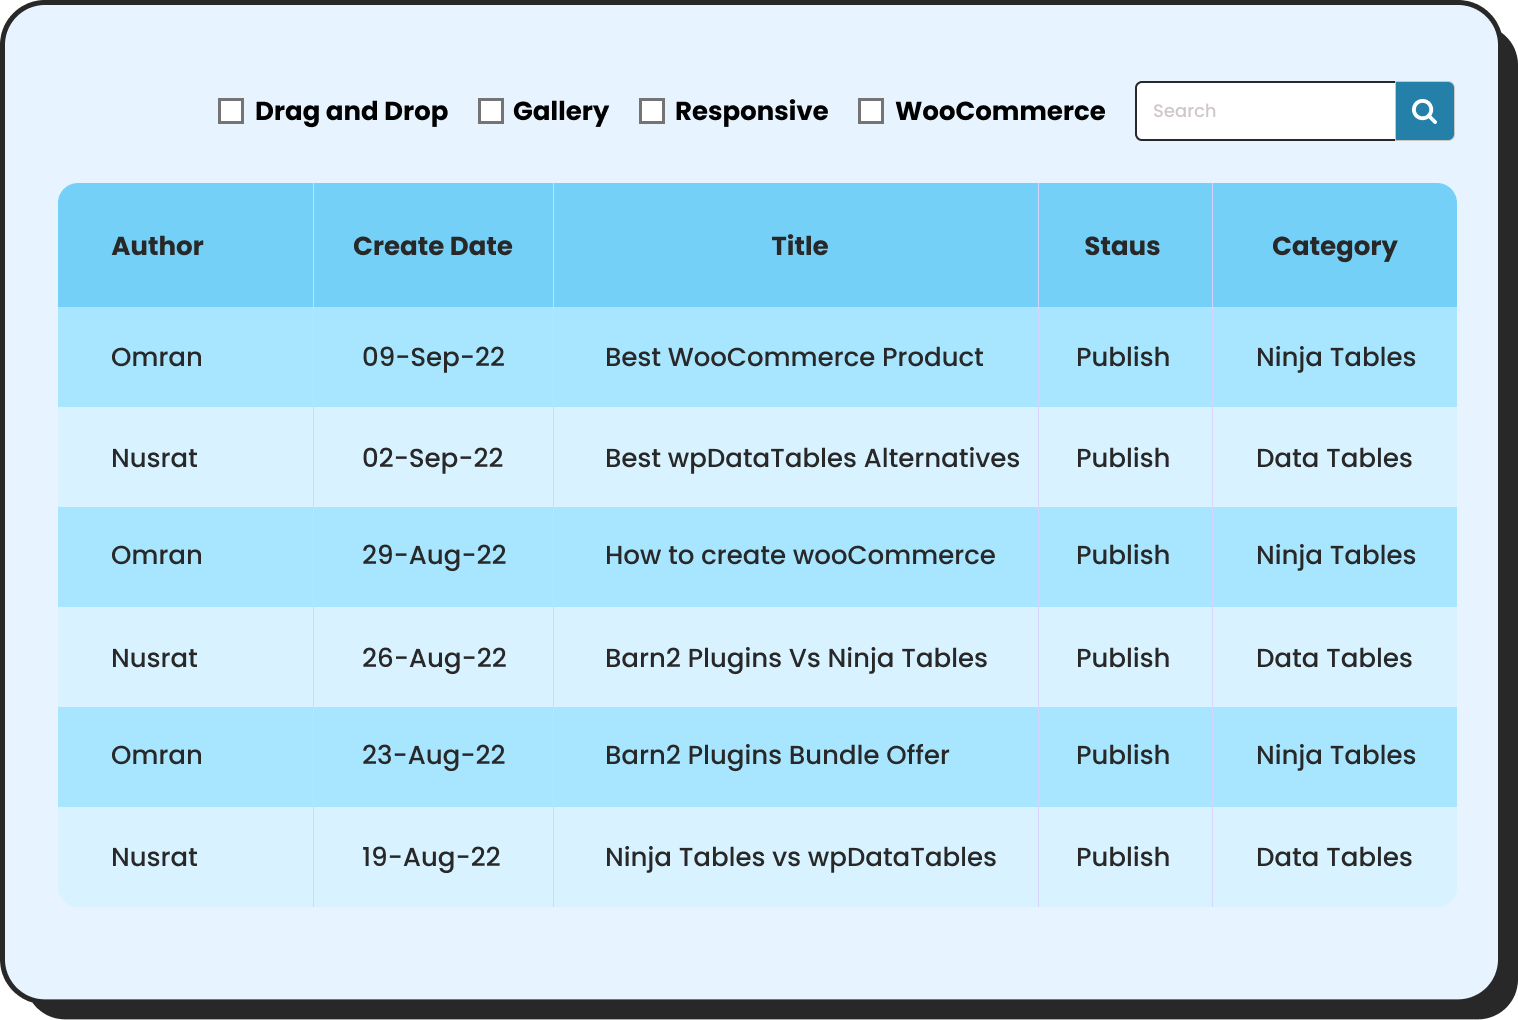
Will content editors update this table through the WordPress admin, or do you need a front-end editing solution? Non-technical users often struggle with HTML tables in the classic editor, while Gutenberg’s table block has limitations for complex data. Dynamic table builder plugins let you do both.
How does this table fit into WordPress’s performance ecosystem?
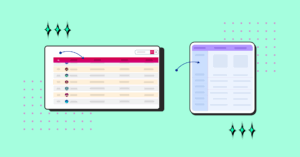
Mobile performance is critical since many WordPress sites see 50% mobile traffic. Sites built with this CMS already load themes, plugins, and media. Adding data-heavy tables with sorting and AJAX can hurt performance. Consider plugins with large data support and responsive compatibility.
What WordPress-specific functionality do you need?
Should your table integrate with user roles and permissions? Do you need to display data from popular plugins like WooCommerce, Advanced Custom Fields, or Contact Form 7? WordPress offers powerful hooks and filters that can make your table dynamic, but they also add complexity. Decide early whether you need an integrated builder or if a static table will suffice.
How will your table solution handle WordPress security and updates?
How will it handle WordPress core updates, plugin conflicts, and security patches? Custom code that works perfectly today might break with the next WordPress update. A well-maintained plugin like Ninja Tables might be more sustainable than a custom solution, especially for client sites that need long-term support.
What’s broken about your current table?
If you’re redesigning, identify the specific pain points. Is it too cluttered? Hard to scan? Missing key actions? Then look out for the easiest but dynamic table builder plugin that’s going to make your web page table design engaging and boost your conversion.
WordPress-Specific Technical Considerations
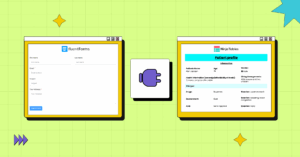
Database Integration: Will your table pull from WordPress’s wp_posts, other form plugins like Fluent Forms, data sources like Google Sheets, or custom CSV files? Choose your plugin carefully to avoid performance issues with these.
Shortcode or Block: Modern WordPress favors Gutenberg blocks over shortcodes. Consider a plugin that provides a custom block for a better user experience and future compatibility.
Mobile Optimization: WordPress’s mobile-first approach means your tables need to work on phones first. Plan for stackable columns, sticky header, priority column, or hide option for mobile layouts.
SEO Impact: Search engines need to crawl your table data. Ensure your solution doesn’t hide important content behind code calls that Google can’t index.
Remember: WordPress users expect content to “just work” across themes, plugins, and updates. Choose your table plugin with WordPress’s ecosystem in mind, not as a standalone web component.
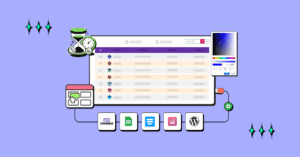
Let’s see how Ninja Tables, as a WordPress table builder plugin, checks all the boxes and more!
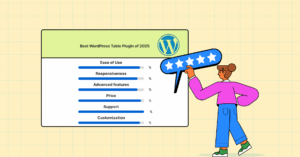
Creative Data Table Design UX Checklist
Your table’s visual appeal creates the first impression, for good reason. When someone lands on your product table, pricing, or comparison table, they’re often at a decision point. Focus on these to achieve the best engagement and conversion rate-
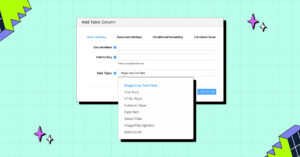
Choose the right table style from the design library
Why table style matters for conversions: If the layout looks outdated, cluttered, or off-brand, it subconsciously signals a negative tone. A clean, branded table display builds trust. People trust what feels authentic. Thoughtful presentation reflects attention to detail and thoughtful service. It’s not just design—it’s part of what drives conversions.
How Ninja Tables Delivers: Ninja Tables offers 3 complete styling libraries with multiple pre-built themes: Semantic UI, Bootstrap 4 & Bootstrap 3. Each of those has their own unique approach, style, design approach for you to go with.
- Modern designs that look professional out of the box
- Responsive layouts that work perfectly on all devices
- Customizable color schemes to match your brand
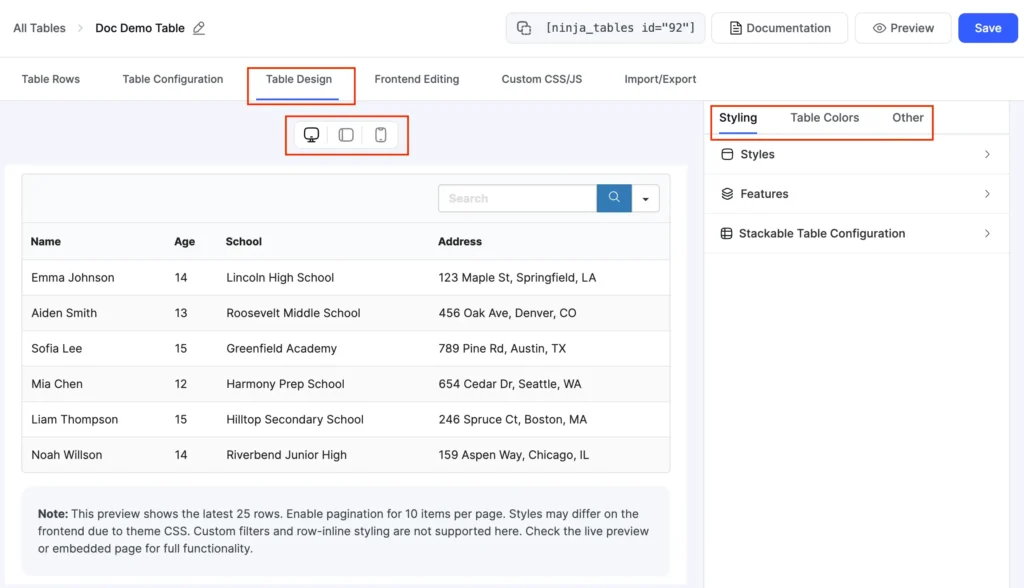
Pro Tip: Don’t just pick the prettiest design—choose the one that best highlights your key conversion elements, site layout, style, and consistency.
Data align to guide the user’s eyes
The psychology behind alignment: Users scan tables in predictable patterns. Right-aligned data with proper white space creates focus and makes information easier to process. Your users have been reading left-to-right since kindergarten. Don’t make them work harder than they need to. Or maintain just one style alignment to minimize skimming issues for the user’s eyes.
Ninja Tables Alignment Features:
- Adjustable alignment for improved readability
- Custom spacing controls to create breathing room
- Header alignment options to match your content

Pro Tip: Cut the redundancy. If every row says “Marketing Lead” and “Sales Lead,” just put “Lead” in the header and use “Marketing” and “Sales” in the ‘Merge’ cells in drag-and-drop or default mode.
Navigation and Interaction
Make scrolling smooth on both horizontal and vertical axes. Jerky scrolling makes tables feel broken, unorganized, and clunky.
Sticky headers are non-negotiable. Users need to keep context as they scroll through data. Consider sticky first columns for horizontal scrolling. The leftmost column often contains the most important identifier.
Use hover states strategically. Don’t clutter the interface with buttons everywhere. Show actions when users hover over rows or cells.
Making actions discoverable should be prioritized; the same goes for CTAs, buttons, and navigation hyperlinks.
Pro Tip: Want some secret? UI table best practices like ‘sticky header horizontal scroll’ is all the rave. Don’t just place it, make horizontal scrolling obvious with visual cues.
Custom search filter functionality
Users who can quickly find relevant options are more likely to convert. Nothing kills conversions faster than a massive table that makes users hunt for information. When someone’s staring at 50 product rows trying to find the right specifications, they’re not thinking about buying—they’re thinking about leaving.
If you want maximum entries in a data table for readability and quick find, then custom filtering is the only way to avoid data overload. Smart search and filtering turn overwhelming data dumps into user-friendly decision tools. Instead of scrolling endlessly, users can zero in on exactly what they need in seconds.
Ninja Tables Search Features:
- Built-in search bar with real-time results
- Column-specific filtering for precise searches
- Advanced search options for complex queries
- Mobile-optimized search interface
- Customizable search placement (top, bottom, or both)


Pro Tip: Learn how to apply customer filters using Ninja Tables with this documentation.
Highlight the best-priced column
The Psychology of Choice: Users look for guidance when comparing options. A properly highlighted “best choice” increases conversions by reducing decision fatigue.
For digital products, that might mean showing a Basic subscription with essential tools, a Standard plan with added support, and a Premium tier with advanced features. For physical items, you can highlight the base product, a mid-range option with customizations, and a premium version that includes extras like features, warranty, or bundled items.
Once users understand what you offer, pricing becomes the deciding factor. A clear comparison helps them weigh features against cost, making their decision easier. Help users find the right fit, without overwhelming them.
PRO | Top! PLUS | BUSINESS |
4.99$/month with 4 days free trail | 9.99$/month with 4 days free trail | 19.99$/month with 4 days free trail |
1 GB Disk Space | 1 GB Disk Space | 1 GB Disk Space |
500 MB Bandwidth | 2 GB Bandwidth | 5 GB Bandwidth |
1 Sub Domain | 3 Sub Domain | 10 Sub Domain |
1 Email Account | 5 Email Account | 10 Email Account |
SMTP | SMTP | SMTP |
Monthly Traffic: 1000 GB | Monthly Traffic: 2000 GB | Monthly Traffic: 3000 GB |
Network Port: 50 Mbps | Network Port: 75 Mbps | Network Port: 100 Mbps |
Ninja Tables Featured Column Options:
- Size emphasis – make your preferred option larger using highlight option
- Color highlighting – use contrasting backgrounds
- Badge integration – add “Most Popular” or “Best Value” labels
- Border emphasis – distinctive borders around featured options
- Custom styling – complete control over featured column appearance
Pro Tip: Here’s a comprehensive guide on how to create a high-converting pricing table that engages customers using the highlight column option to lead the focus to the plan most popular or you want them to focus on.
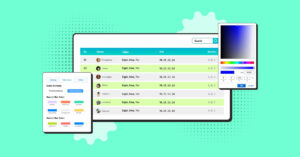
Customized background to improve readability
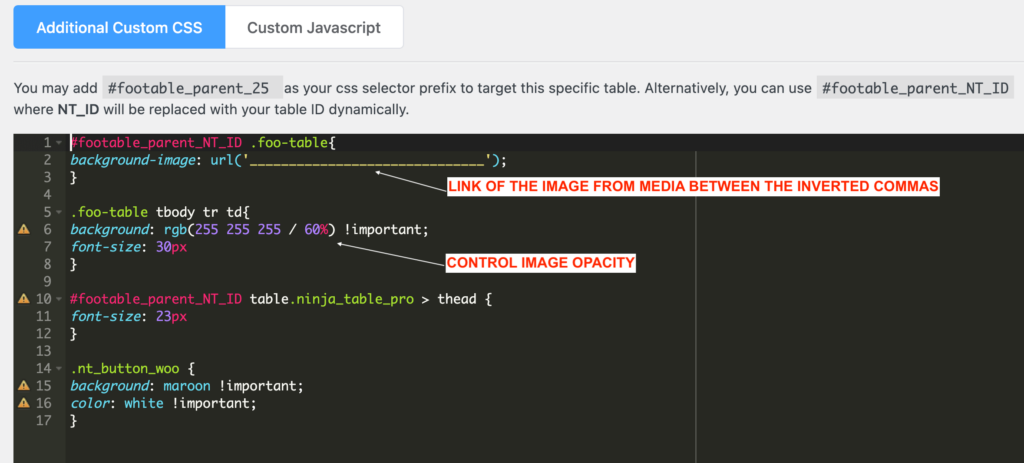
Take a store selling authentic, family-recipe salsa—it’s not just about the flavor, but the story, culture, heritage, and sense of belonging behind it. To reflect that essence visually, even something as simple as a customized table background can make a big impact. Ninja Tables lets you add subtle, branded background images through custom CSS, enhancing your layout without sacrificing readability.
Use the following CSS in the “Custom CSS” tab and add a custom image from media. You can adjust opacity, position, or table text color/size etc too!
Color Psychology in Tables: Colors do more than decorate—they guide attention, evoke emotion, and influence buying decisions. If your store looks generic, visitors will likely bounce. But add personality and a customized touch, and your brand starts to feel unique; something people connect to and remember by.
Ninja Tables Background Customization:
- Real-time preview so you see changes instantly
- Brand color integration to maintain consistency
- Header and body color separation for a clear hierarchy
- Row alternating colors for improved readability
- Custom color scheme for precise brand matching
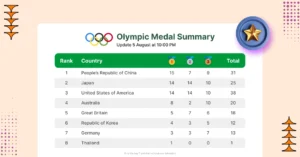
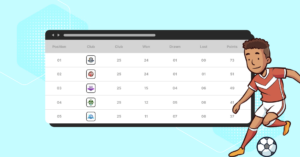
| Club | 1st Grade | 2nd Grade | 3rd Grade | U18s | Bonus | Total |
|---|---|---|---|---|---|---|
| Blacktown Workers | 3914 | 875 | 509 | 613 | 300 | 6210 |
| Macarthur Orioles | 3000 | 915 | 377 | 565 | 100 | 4958 |
| Ryde Hawks | 2184 | 750 | 650 | 700 | 0 | 4284 |
| Baulkham Hills | 2283 | 700 | 300 | 687 | 100 | 4069 |
| Manly Eagles | 1925 | 1050 | 242 | 675 | 100 | 3992 |
| Cronulla Sharks | 1187 | 646 | 88 | 727 | 0 | 2648 |
| Greater Western | 764 | 700 | 425 | 121 | 0 | 2010 |
| Canterbury Vikings | 1575 | 0 | 188 | 150 | 0 | 1914 |
Pro Tip: Ninja Tables gives you the flexibility to customize every aspect according to your brand aesthetic, style, and more! If you want to adjust your table background image to match your brand image, you can do so using this WordPress table plugin. Read the guide on how to upload a background table image to create a more comprehensive brand product table.
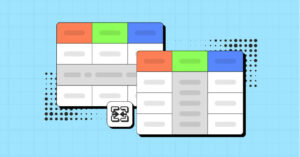
Mobile responsiveness
The Mobile Reality: Most of the table views happen on mobile devices, as people tend to shop on their phone, with easy access, on the go. If your table doesn’t work on mobile, you’re losing more than half your potential conversions. Slow-loading tables or stores can create a huge slump in customers, as people wait just 3 seconds for a site to load; otherwise, they jump back to the wagon and look for alternatives.
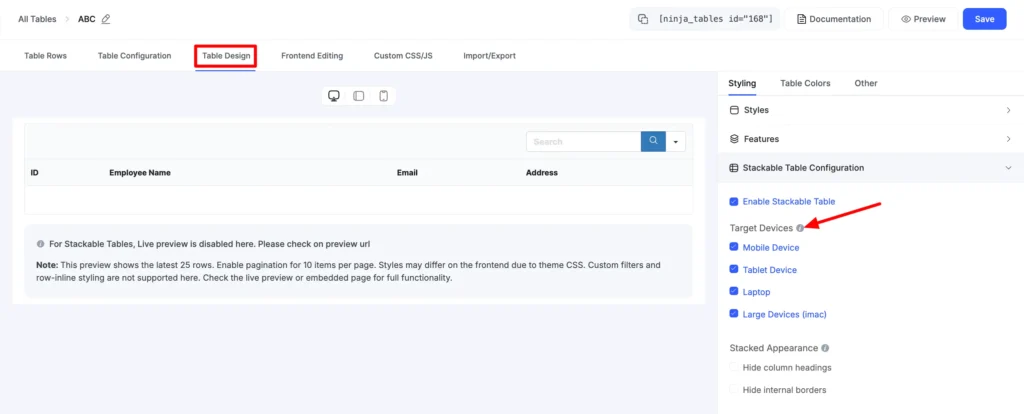
Ninja Tables Mobile Solutions:
- Stackable table configuration – transforms rows into mobile-friendly cards
- Responsive breakpoints – control what shows on different devices
- Touch-friendly interactions – optimized for finger navigation
- Mobile-specific styling – different layouts for different screen sizes
- Prioritize the most important columns for the default mobile view
- Pagination vs. infinite scroll: Pagination is better for finding specific items than infinite scroll.
Pro Tip: Implement UX Design pagination best practices to make everything smooth. Here’s a complete guide on ways to create a responsive table in WordPress.
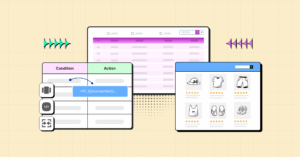
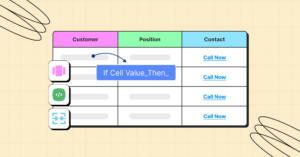
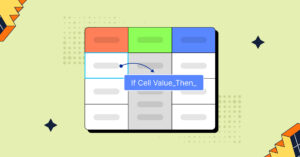
Conditional formatting for dynamic highlighting
Smart Data Visualization: Conditional formatting automatically highlights important information based on rules you set, making key data impossible to miss.
Ninja Tables Conditional Formatting:
- Value-based highlighting – automatically color-code based on data
- Rule-based formatting – set conditions that trigger styling changes
- Multiple condition support – complex rules for sophisticated tables
- Real-time updates – formatting changes as your data changes
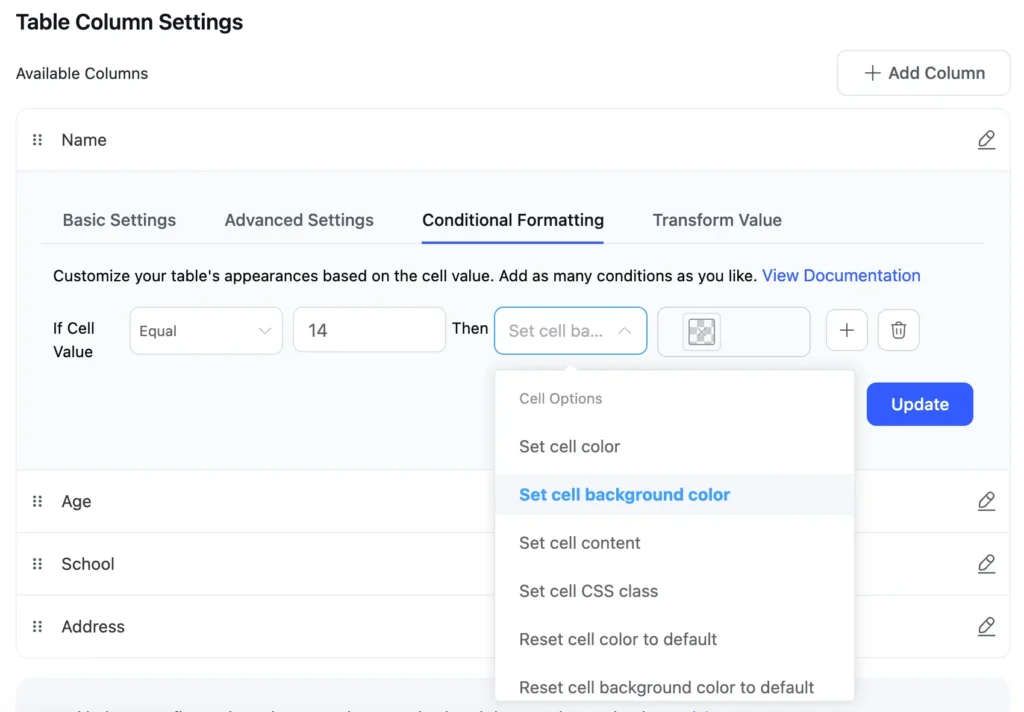
Pro Tip: Unlike basic filtering, which simply hides data that doesn’t match set criteria, this approach keeps all your data visible—but draws attention to what matters most. When certain conditions are met, key cells are highlighted to guide users’ eyes exactly where you want them. It’s not just about cleaning up data—it’s about prioritizing it too. Here’s a detailed guide on how to use conditional formatting in WordPress Tables.
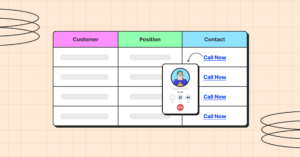
Add interactive elements and hover effects
The Engagement Factor: Interactive tables feel more modern and engaging. Users spend more time exploring interactive elements, leading to higher conversion rates.
Ninja Tables Interactive Features:
- Hover rows for visual feedback
- Clickable elements throughout the table
- Dynamic buttons that respond to user actions
- Smooth pagination between states
- Use multimedia, hyperlinks for better exploration
- Use icons in a drag-and-drop table
| Name | Position | Office | Age | Start date | Salary |
|---|---|---|---|---|---|
| Zorita Serrano | Software Engineer | San Francisco | 56 | 2012/06/01 | $115,000 |
| Zenaida Frank | Software Engineer | New York | 63 | 2010/01/04 | $125,250 |
| Yuri Berry | Chief Marketing Officer (CMO) | New York | 40 | 2009/06/25 | $675,000 |
| Vivian Harrell | Financial Controller | San Francisco | 62 | 2009/02/14 | $452,500 |
| Unity Butler | Marketing Designer | San Francisco | 47 | 2009/12/09 | $85,675 |
| Timothy Mooney | Office Manager | London | 37 | 2008/12/11 | $136,200 |
| Tiger Nixon | System Architect | Edinburgh | 61 | 2011/04/25 | $320,800 |
| Thor Walton | Developer | New York | 61 | 2013/08/11 | $98,540 |
| Tatyana Fitzpatrick | Regional Director | London | 19 | 2010/03/17 | $385,750 |
| Suki Burks | Developer | London | 53 | 2009/10/22 | $114,500 |
| Sonya Frost | Software Engineer | Edinburgh | 23 | 2008/12/13 | $103,600 |
| Shou Itou | Regional Marketing | Tokyo | 20 | 2011/08/14 | $163,000 |
| Shad Decker | Regional Director | Edinburgh | 51 | 2008/11/13 | $183,000 |
| Serge Baldwin | Data Coordinator | Singapore | 64 | 2012/04/09 | $138,575 |
| Sakura Yamamoto | Support Engineer | Tokyo | 37 | 2009/08/19 | $139,575 |
| Rhona Davidson | Integration Specialist | Tokyo | 55 | 2010/10/14 | $327,900 |
| Quinn Flynn | Support Lead | Edinburgh | 22 | 2013/03/03 | $342,000 |
| Prescott Bartlett | Technical Author | London | 27 | 2011/05/07 | $145,000 |
| Paul Byrd | Chief Financial Officer (CFO) | New York | 64 | 2010/06/09 | $725,000 |
| Olivia Liang | Support Engineer | Singapore | 64 | 2011/02/03 | $234,500 |
| Michelle House | Integration Specialist | Sidney | 37 | 2011/06/02 | $95,400 |
| Michael Silva | Marketing Designer | London | 66 | 2012/11/27 | $198,500 |
| Michael Bruce | Javascript Developer | Singapore | 29 | 2011/06/27 | $183,000 |
| Martena Mccray | Post-Sales support | Edinburgh | 46 | 2011/03/09 | $324,050 |
| Lael Greer | Systems Administrator | London | 21 | 2009/02/27 | $103,500 |
| Jonas Alexander | Developer | San Francisco | 30 | 2010/07/14 | $86,500 |
| Jennifer Chang | Regional Director | Singapore | 28 | 2010/11/14 | $357,650 |
| Jennifer Acosta | Junior Javascript Developer | Edinburgh | 43 | 2013/02/01 | $75,650 |
| Jenette Caldwell | Development Lead | New York | 30 | 2011/09/03 | $345,000 |
| Jena Gaines | Office Manager | London | 30 | 2008/12/19 | $90,560 |
Pro Tip: Interactive design shouldn’t overwhelm your message. With today’s limited attention spans, your tables need to grab attention and communicate clearly. Ninja Tables helps you strike that balance, showcasing essential product details in an engaging, streamlined format. Explore the Templates Page for real-life use cases and cool design tables with customizable layouts.
Get table templates for free
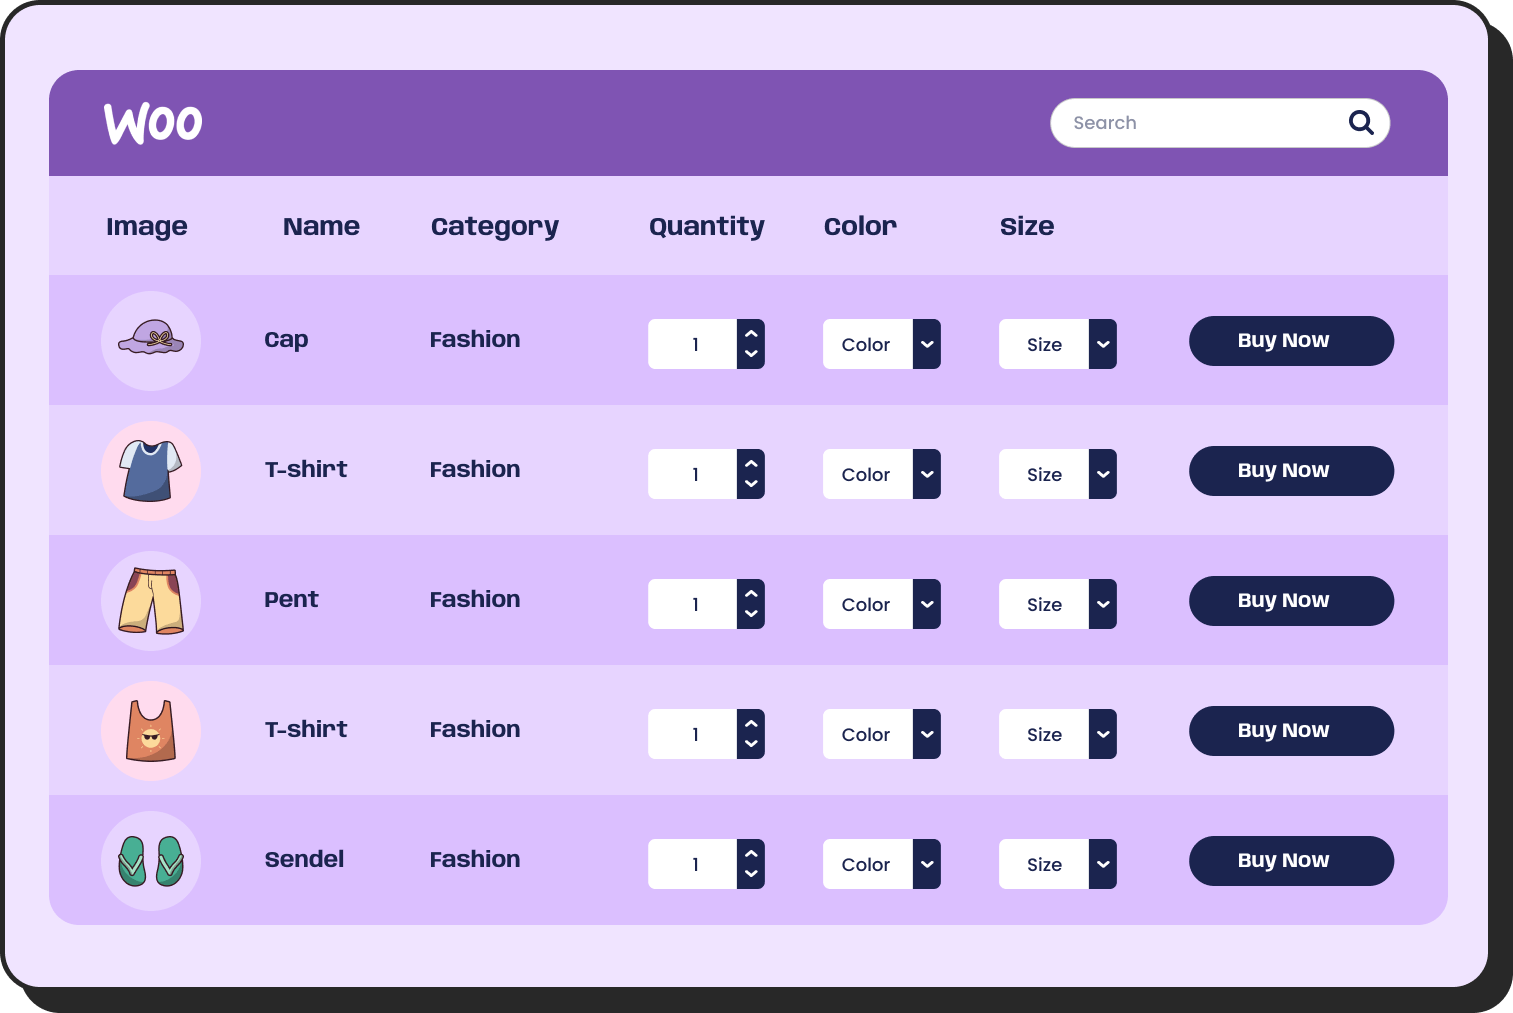
WooCommerce
Amazon Products
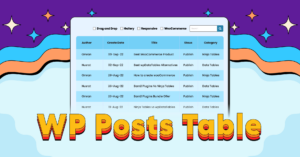
WP Posts
Products Comparison
Pricing Table
Features Comparison
These examples are built to inspire creative data table design. Also, this guide on interactive data visualization will help you along the way.
Bonus: Advanced Ninja Tables Features for Maximum Conversions
Advance doesn’t have to mean complicated. With Ninja Tables, many of the advanced features are designed for everyday users, not just developers. Some of the most powerful features are surprisingly easy to use—and they can completely transform how your data looks and works. Follow along this guide on Ninja Tables features that simplify your data overload, visualization, and life.
Data Rich Interface Design with Styling
Enable users to select multiple rows and perform actions, reducing friction in the conversion process.
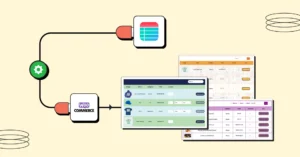
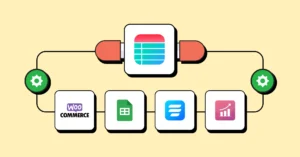
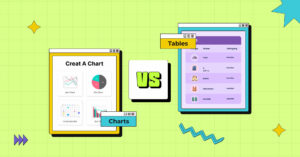
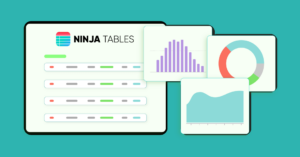
Ninja Charts with Table Builder
Transform your table data into visual charts that make comparisons easier and more compelling.
Dynamic Content Support
Add buttons, links, images, videos, and other media directly to your tables to create rich, engaging experiences.
Advanced Filtering and Sorting
Let users customize their view to find exactly what they need quickly.
Read this guide to learn why you need WordPress tables to grow your business.
The Conversion Problem: Why Users Abandon Tables
Users abandon tables when they can’t quickly locate relevant information. Without proper search and filtering functionality, visitors leave frustrated rather than converting.
The user journey breaks down like this:
- Discovery phase – Users find your site through search or referrals
- Evaluation phase – They scan tables to compare options and features
- Decision phase – They assess whether your product meets their needs
- Action phase – They either convert or leave
Where most tables fail:
- Information overload– Too much data displayed without organization
- Poor navigation– No way to sort, filter, or search through options
- Unclear hierarchy– Important features buried among less relevant details
- Slow comprehension– Users can’t quickly grasp key differentiators
- Confusing icons, identifiers– Unclear symbols and cluttered interface elements
- Poor CTA placement– CTA doesn’t lead to actionable landings
- Poor readability– Bad typography, spacing, and colors make data hard to scan
- Limited responsiveness– Tables break on mobile or require horizontal scrolling
- Slow loading speed– Large datasets cause pages to freeze or load slowly
- Complex customizations– Users can’t adjust columns or personalize their view
- Hard to integrate different data types– Mixing text, numbers, images creates visual inconsistencies
Bottom line: If users can’t find and compare the information they need within seconds, your conversion rate suffers. Well-designed table interfaces guide users from curiosity to purchase by making evaluation effortless.
Conclusion
Creating high-converting tables isn’t about having all the fancy features or the flashiest design; it’s about guiding users through information in a way that makes decisions easy and actions clear.
Ninja Tables gives you all the tools you need to implement these conversion-focused strategies without complex CSS or coding. From responsive design to conditional formatting, every feature is designed to help you turn more window shoppers into customers.
The absolute best part? You can start implementing these strategies immediately. Pick one or two tips that resonate most with your business, brand image, and implement them with Ninja Tables. Live up to your brand’s mission by delivering an exceptional experience in every detail.
Ninja Tables– Easiest Table Plugin in WordPress


Add your first comment to this post