
Data Tables, Display Tables, and Decision Tables: Know the Difference
Not all tables are created equal. Sure, they all have that familiar structure, but their purposes couldn’t be more different. You’ve probably mixed up table types more times than you’d like to admit.
We wouldn’t use a hammer to turn a screw. So, why are so many people using the wrong tables for their data? The terms “Decision Table,” “Data Table,” and “Display Table” get thrown around a lot, and honestly, they’re not interchangeable.
The key difference lies in user interaction and intended outcome. Some tables are meant to help users make decisions, others to display or manipulate data, and some just to present the information properly.
Let’s break down what each table type is, what it does best, and when you should use one.
What Makes a Table More Than Just Rows and Columns?
A table isn’t just a grid of cells; it’s a vehicle for information. And different journeys require very different vehicles. It’s about considering your users’ needs and cognitive response, then shaping the table to fit the task and lead them to the destination.
A table becomes more than just rows and columns when it tells a story with easily scannable descriptions, guides decisions, or simplifies complexity.
Each table type’s value lies in its structure, logic, and interpretability. Decision tables use conditions and actions to guide choices systematically. Data tables organize complex datasets for efficient retrieval and analysis, while display tables prioritize readability and user interaction. The right design ensures users can compare, filter, and interpret information quickly, turning raw data into actionable insight.
So, whether you’re building dashboards with tools like Ninja Tables (which handles all three types beautifully, by the way) or just trying to make sense of your data presentation strategy, you need to know which table does what.
Here are the 3 different layouts for you to get the visual cue of what we mean.
| Name | Contact | Managing Property |
|---|---|---|
| Sarah Mitchell | +1 212-555-4839 | Skyline Tower Penthouse – Unit 1203 |
| David Johnson | +1 646-555-7281 | Green Valley Apartments – Block B |
| Donna Rodriguez | +1 718-555-6042 | Palm Grove Villas – Villa 22 |
| Michael Carter | +1 917-555-8394 | CityOne Corporate Plaza – Suite 401 |
| Jessica Wong | +1 347-555-9512 | Riverbend Warehouse – Lot 9 |
| Daniel Hughes | +1 929-555-3678 | Midtown Business Hub – Office 14 |


All these tables are made with Ninja Tables.
Data Tables: The Common One
Now we’re talking! This is the table type most of us interact with daily. A data table is designed for displaying large, complex datasets in a way that’s easy for users to explore, analyze, and get insights from.
Its core philosophy is data discovery. It assumes the user has a question and provides an entire workshop of tools to help them find the answer within a large dataset. With an active, exploratory experience, its detail-centric approach often leads to a greater cognitive load on viewers.
What Makes Data Tables Special?
Data tables transform raw information into actionable insights. They come loaded with features like sorting, filtering, pagination, and search. Users don’t just look at the data; they interrogate it to get the answer they came looking for.
So, what’s the secret sauce? Functionality over form. Every feature in a data table serves the purpose of helping users find, filter, or better understand their data.
A great data table offers more than the obvious and goes beyond some cells and columns:
- Sorting: Let users click a column header to sort the data alphabetically or numerically. It’s amazing how many sites still miss this!
- Filtering: Allow users to narrow down thousands of rows to just the ones they need based on specific criteria.
- Searching: A search bar that instantly scans the entire dataset. This is a must-have for large tables.
- Pagination: Breaking down a massive table into digestible pages (e.g., showing 10, 25, or 100 entries at a time).
- Advanced Filtering: Not just a search box. It’s a multi-column filtering tool (e.g., show me all users in California who signed up after 2024), or range sliders for numerical data.
- Conditional Formatting: The ability to change a cell’s appearance based on its value. For example, turning negative financial numbers red or showing a low stock alert.
- Bulk Actions: Checkboxes on each row that allow users to select multiple items and apply a single action, like “Export,” or “Delete.” This is a great productivity hack.
- Cell Types: A cell doesn’t have to be just text. It can be a clickable email link, a pop-up image, a rating system, or even another nested chart or table.
Real-World Applications: They’re perfect for any large collection of data you want users actually to use, not just look at. Data tables shine in-
- Admin dashboards
- Customer relationship management (CRM) systems
- Inventory management
- Financial reporting
| Campaign Name | Channel | Budget Allocated | Spend Used | Revenue Generated | ROI (%) | Notes |
|---|---|---|---|---|---|---|
| Spring Launch | $5,000 | $4,800 | $21,000 | 337.50% | High return, budget on point | |
| Summer Promo | Google Ads | $7,000 | $6,300 | $19,800 | 214.30% | Slight underuse |
| Product Teaser | $3,500 | $3,800 | $9,000 | 136.80% | Overspent slightly | |
| Lead Magnet Test | $2,000 | $2,000 | $4,400 | 120.00% | Fairly balanced | |
| BFCM Campaign | Meta (FB/IG) | $10,000 | $9,200 | $36,000 | 291.30% | Top performer |
| Webinar Ads | YouTube Ads | $4,000 | $3,500 | $11,200 | 220.00% | Under budget, great ROI |
| App Install Boost | Google UAC | $6,000 | $5,900 | $12,000 | 103.40% | ROI barely above breakeven |
| End-of-Season Sale | $2,500 | $2,200 | $6,100 | 177.30% | Cost-effective | |
| Retargeting Push | $3,000 | $3,100 | $7,500 | 141.90% | Slight overspend, good return | |
| Abandoned Cart | $1,000 | $950 | $4,300 | 352.60% | High ROI, minimal cost |
- Any scenario where users need to dig into datasets
| URL / Page Title | Keyword Cluster | Position | Traffic % | Top Keyword | KD | Search Vol. | Backlinks | Notes |
|---|---|---|---|---|---|---|---|---|
| /fall-marketing-ideas | Fall Marketing | 5 | 23.70% | fall marketing ideas | 38 | 1.6K | 22 | Potential to reach top 3 |
| /black-friday-campaign-checklist | BFCM Checklist | 9 | 18.20% | black friday checklist | 44 | 2.3K | 16 | Refresh for 2025 |
| /compare-wordpress-plugins | Plugin Comparison | 3 | 14.60% | feature comparison | 35 | 1.2K | 30 | High backlink potential |
| /email-marketing-trends-2025 | Email Marketing | 6 | 12.80% | email marketing trends | 29 | 950 | 14 | Needs internal linking boost |
| /best-woocommerce-store-examples | WooCommerce Store Design | 12 | 9.50% | woocommerce examples | 52 | 670 | 5 | Improve keyword usage in H2s |
| /how-to-use-ninja-tables | WordPress Tables | 15 | 8.30% | ninja tables tutorial | 22 | 800 | 10 | Add FAQs for long-tail keywords |
| /content-calendar-template-2025 | Content Planning | 4 | 6.70% | content calendar | 31 | 500 | 7 | Link from newsletter/blog |
| /holiday-email-automation | Email Automation Campaigns | 10 | 3.90% | holiday email funnel | 36 | 320 | 3 | Needs CTA optimization |
Display Tables: The Presenter
Display tables are the minimalists of the table family. Clean, simple, and focused on one job: presenting information clearly- no bells, no whistles, just pure data presentation.
Display tables excel at making complex information digestible. They’re the difference between a wall of text and an organized, scannable layout that actually makes sense.
When Simple Wins
Sometimes you don’t need sorting or filtering, but it helps to add a visual break tool to give interactivity more chances, like a search tab, pagination, leading hyperlinks, multimedia options (images, videos, URL). Sometimes you just need to show data in a clean, readable format. That’s where display tables shine:
- Product pages
- eCommerce store pages
- Feature pages
- Pricing tables
Comparison | Product X | Product Y |
Preview |  |  |
Announced | 2022, February 09 | 2021, September 13 |
Status | Available. Released 2022, February 24 | Available. Released 2021, September 25 |
Size | 6.1 inches | 6.1 inches |
Weight | 6.14 ounces | 5.78 ounces |
Processor | A15 | A14 |
Chipset | Apple A15 Bionic (5 nm) | Exynos 2200 (4 nm) - Europe |
Camera | 12 MP, f/1.6, 26mm (wide), 1.7µm, dual pixel PDAF, sensor-shift OIS | 12 MP, f/1.6, 26mm (wide), 1.7µm, dual pixel PDAF, sensor-shift OIS |
Battery | Li-Ion 3240 mAh, non-removable | Li-Ion 3000 mAh, non-removable |
Resolution | 2532x1170 | 2532x1170 |
Buy |
The design philosophy of display tables has a unique take on the basic grid system. They follow the “less is more” principle. Every element serves readability:
- Clear typography: Easy-to-read fonts and sizing
- Consistent spacing: Proper padding and margins
- Subtle styling: Just enough visual design to guide the eye
- Responsive design: Adapts perfectly to different screen sizes
What about mobile users? Display tables are functional on both big and smaller screens because they’re simpler. Fewer interactive elements means fewer things that can break on touch interfaces.
| Image | Name | Category | Price | Quantity | Buy |
|---|---|---|---|---|---|
 | Beach essentials | Summer | Original price was: $50.00.$38.00Current price is: $38.00. | | |
 | Beach slippers | Summer | $15.00 | | |
 | Beach towel | Summer | $33.00 | | |
 | Beach hats | Summer | $28.00 | |
Decision Tables: The Complex One
A decision table’s natural habitat is the backend details of a logical construct. Here’s where things get messy. The term “decision table” is now widely used by everyone and has been completely mixed up by most people building websites today.
Decision table
First, let’s correct a common misconception. In its original form, a decision table is a logic modeling tool used in systems analysis and business rules management.
Let’s work with the modern interpretation since that’s what most people expect.
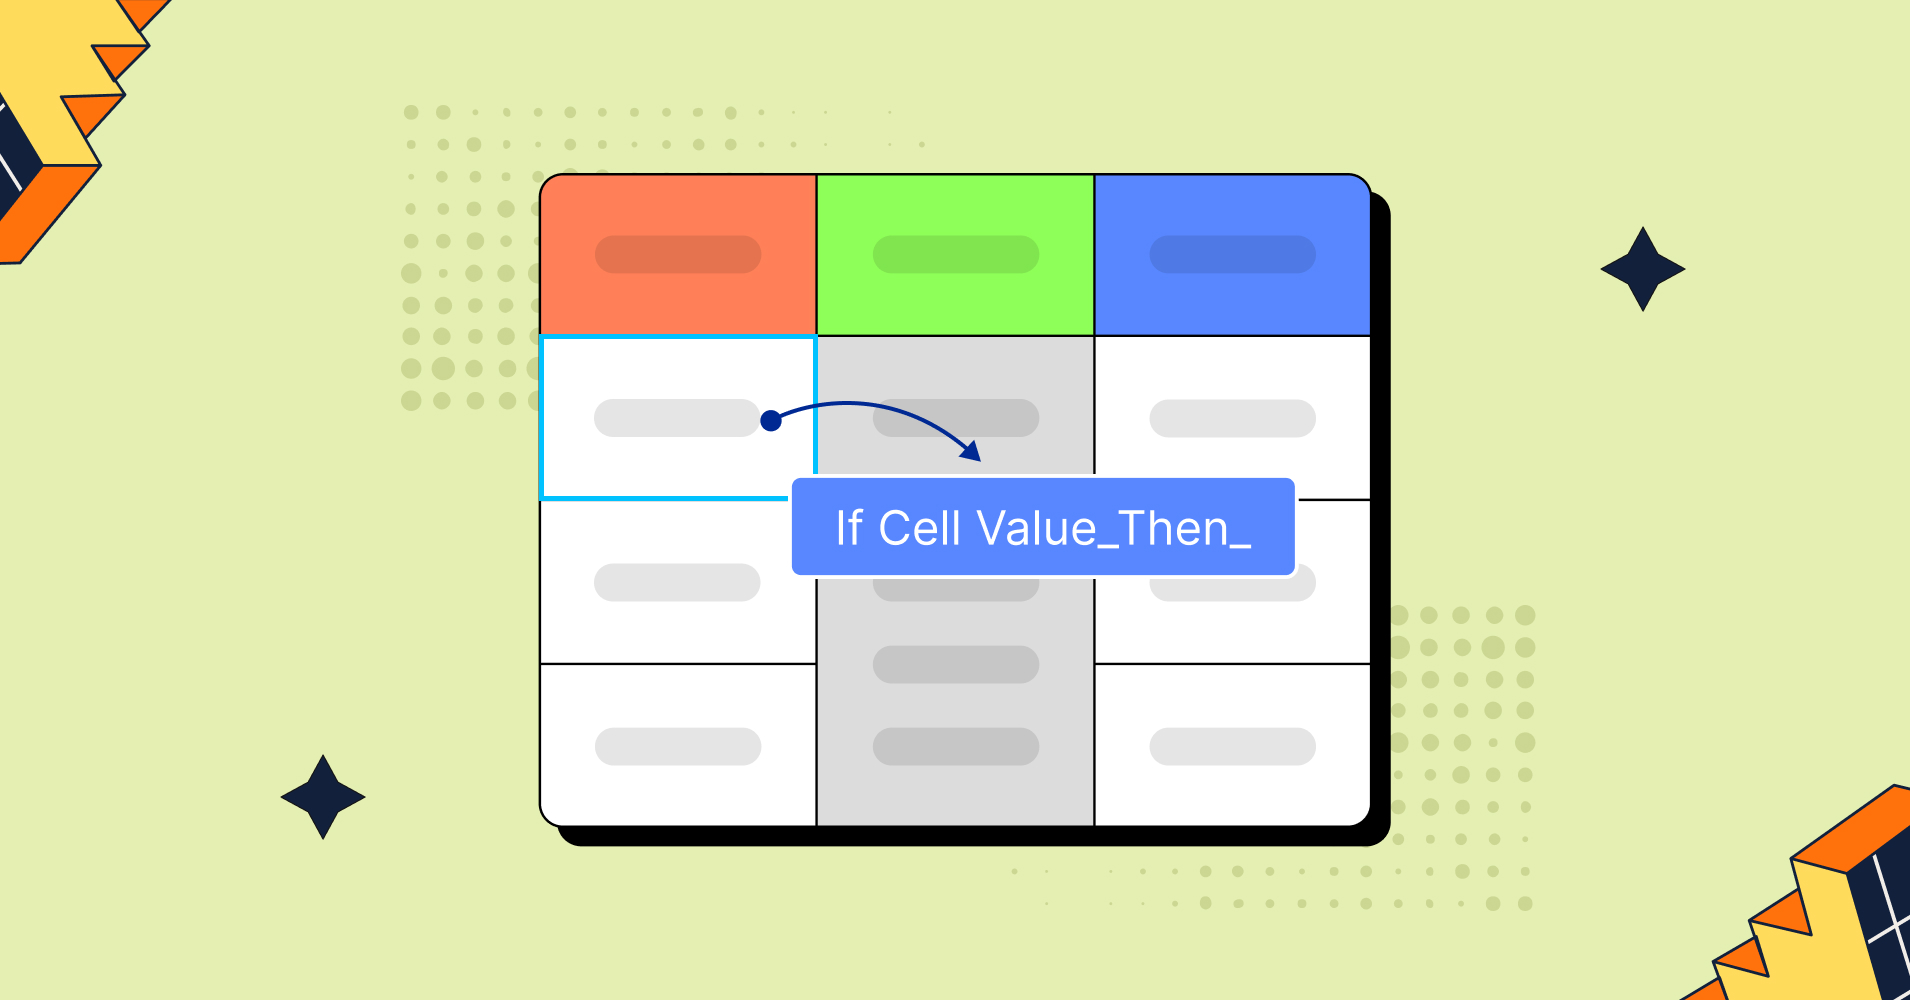
At its core, a decision table is essentially an “if-then” question. It consists of 4 parts as in Condition, action, alternative conditions, and action entries.
Essentially, it’s a super-organized checklist for a computer or a business analyst. You’ll rarely see a raw decision table on a public-facing website. Its home is in software requirement documents, business analysis, and the backend of systems that need to make automated choices.
Like insurance premium calculations or e-commerce shipping rule engines. Not exactly front-page material.
Decision table in front-end aspects
So, what happened? Marketing teams and web designers started calling comparison tables “decision tables” because they help users make decisions using the logical construct. While there’s some logic to this naming, it’s created massive confusion in the tech world.
How Decision Tables Apply in Marketing
Marketing often deals with segmentation, personalization, and automated decisions. A decision table makes those rules explicit. Examples:
- Email Marketing Automation
- Conditions: subscriber activity (opened last email? clicked a link?), purchase history, subscription plan.
- Actions: send discount code, nurture sequence, upsell campaign, or remove from list.
- Customer Segmentation
- Conditions: location, purchase frequency, cart value.
- Actions: show seasonal promo, bundle offer, or free shipping banner.
- Ad Targeting Rules
- Conditions: age group, interest category, campaign stage.
- Actions: display creative A vs B, adjust budget, or retarget with urgency.
- Product Recommendation Engines
- A decision table can map customer preferences (budget range + category + rating filter) → suggested product set.
Decision tables can help marketers design precise automation rules and front-end developers implement user-facing decision flows. They’re especially powerful when combined with personalization, recommendation systems, or interactive product comparisons. You can show them with comparison table mode too!
| 1 | 2 | 3 |
|---|---|---|
 Winter Starter Pack - Cozy Picks A budget-friendly bundle!
Ships by: 1 Week Price: $29.99 Sale Ends: Tomorrow |  Holiday Essentials - Most Popular The all-rounder bundle!
Ships by: 4 Days Price: $59.99 Sale Ends: Monday |  Festive Luxury - Premium Choice Gift that leaves impression!
Ships by: 2 Days Price: $149.99 Sale Ends: Tonight |
Building Real Decision Logic with Ninja Tables
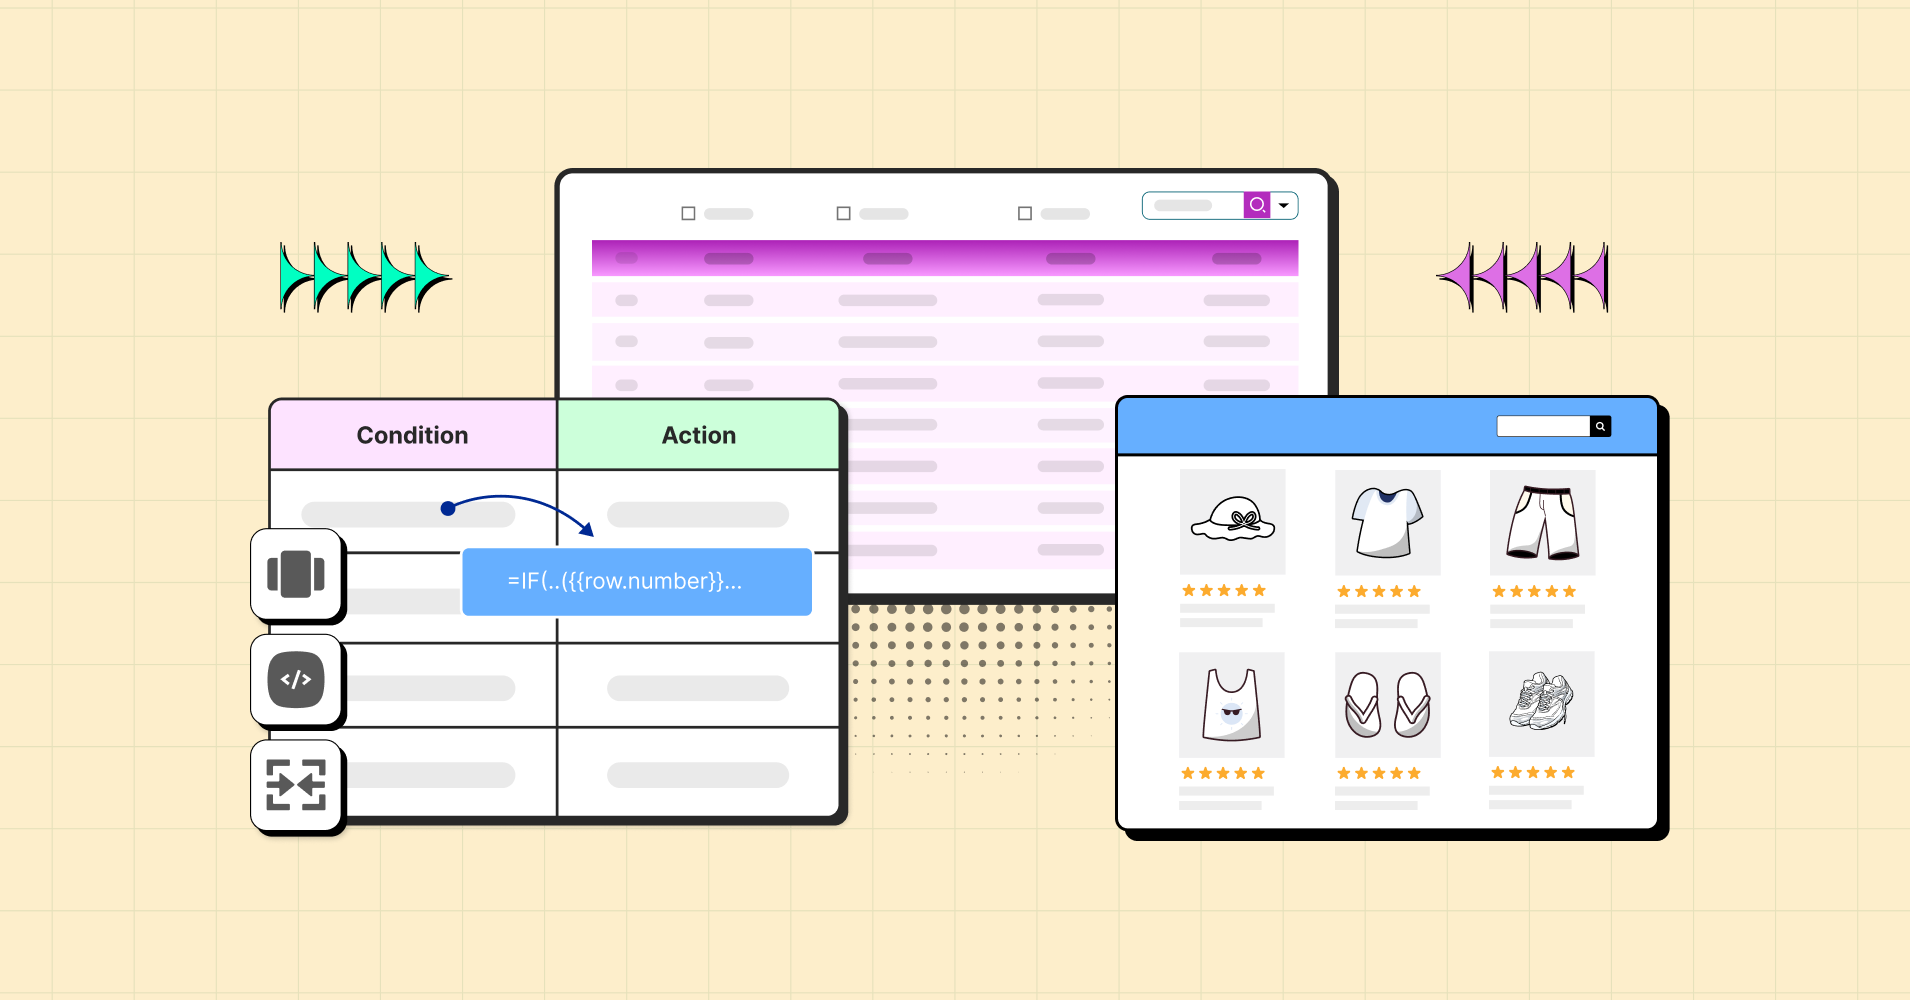
Here’s where things get interesting for modern web applications. While traditional decision tables require complex business rule engines, tools like Ninja Tables bridge the gap by allowing you to create logical constructs within regular data tables.
Ninja Tables lets you apply conditions and actions to cell items based on other cell values, creating mini decision engines within your data presentations.
The Transform Value feature works by:
- Setting conditions: Define rules based on column values ‘Reference Shortcode’
- Applying transformations: Automatically change display values when conditions are met
- Real-time updates: Sync transformations instantly when underlying data changes
- Multiple rule support: Layer complex decision logic with multiple conditions
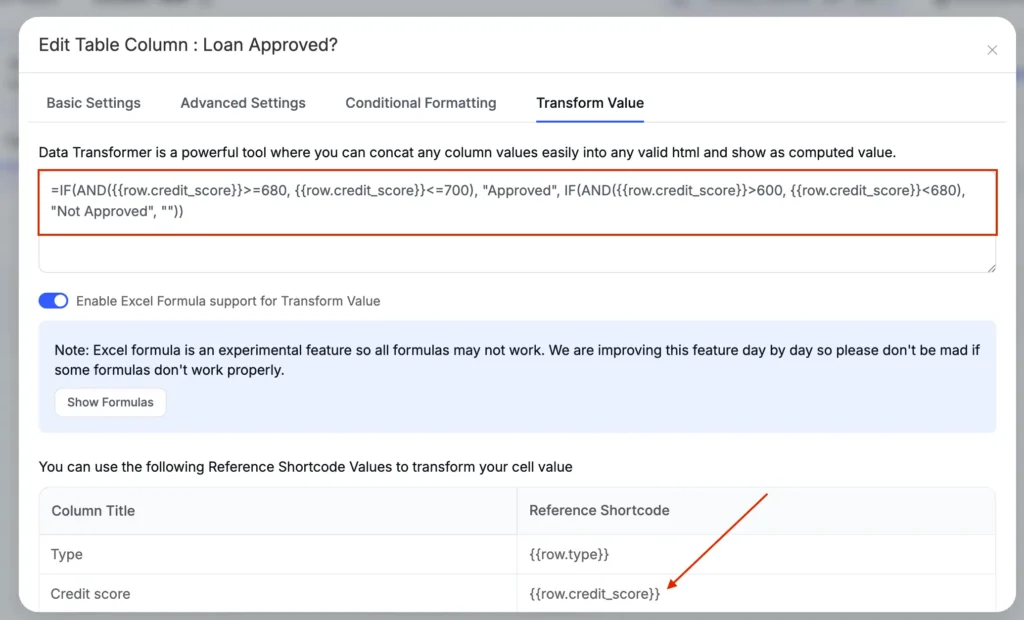
For example, you can set up a “Loan Approved?” column that automatically updates based on credit score values:
- Credit score > 750 = “Approved”
- Credit score 600-749 = “Under Review”
- Credit score < 600 = “Declined”
The system evaluates these conditions automatically, transforming raw data into actionable business intelligence without manual intervention.
This functionality turns simple data tables into powerful internal management systems. Instead of manually updating status fields, you can establish logical rules that handle updates automatically:
- HR systems: Employee status based on performance metrics
- Inventory management: Stock alerts based on quantity thresholds
- Customer segmentation: Priority levels based on purchase history
- Project tracking: Status updates based on completion percentages
What makes this approach powerful? Non-technical team members can understand and modify the logic without diving into complex code or business rule engines. Its decision table functionality is made accessible.
Choosing the Right Table Type
How do you decide which table type fits your needs? Ask These Questions-
| What’s the user’s primary goal? | How much interaction is needed? | What’s the data complexity? |
| Making a decision → Decision table | High interaction → Data table | Simple, scannable data → Display table |
| Working with data → Data table | Moderate interaction → Decision table | Complex, dynamic data → Data table |
| Reading information → Display table | Minimal interaction → Display table | Comparative data → Decision table |
Common Mistakes to Avoid
Let’s talk about what goes wrong when people mix up these table types.
The Over-Engineering Trap
Adding sorting functionality to a simple contact list display table? That’s like putting racing stripes on a minivan. It doesn’t make it faster; it just confuses everyone. Or adding a custom filter to every column, where there is no need to add another load of complexity on top of that.
The Under-Engineering Problem
Using a basic HTML table for complex data management is equally problematic. Users expect to be able to search, sort, and filter when dealing with large datasets. Don’t disappoint them.
The Identity Crisis
The worst mistake? Tables that can’t decide what they want to be. A table that’s half comparison, half data manipulation, and half display serves nobody well.
Different Tables- Best Practices
For Decision Tables
- Keep the comparison criteria consistent
- Highlight the recommended option subtly
- Make action buttons prominent
- Test the decision flow with real users
For Data Tables
- Implement progressive disclosure for complex features
- Provide clear feedback for all interactions
- Optimize for the most common use cases
- Don’t forget mobile responsiveness
See some common data management challenges and solutions to become extra cautious when implementing data tables in your work system.
For Display Tables
- Focus on typography and spacing
- Use zebra striping sparingly
- Keep it accessible with proper markup
- Test readability across devices
The Future of Tables
Tables aren’t going anywhere, but they’re definitely evolving. Modern web applications demand more sophisticated data presentation, and table technology is keeping pace.
Emerging Trends
- AI-powered insights: Tables that suggest relevant data patterns
- Voice interaction: “Show me last month’s sales data.”
- Collaborative features: Real-time multi-user editing
- Advanced visualizations: Inline charts and graphs within table cells
So, what’s next for your table strategy? The landscape is constantly changing, but the fundamental principle remains the same: match the table type to the user’s needs. Give them what they’re eagerly searching for instantly.
Wrapping Up
Understanding the difference between decision tables, data tables, and display tables isn’t just about technical specifications—it’s about creating better user experiences. Each table type serves a specific purpose, and using them correctly can transform how users interact with your data.
The next time you’re planning a data presentation, take a moment to consider what your users actually need to do with that information. Are they making decisions? Working with data? Or simply consuming information? Your answer will guide you to the right table type, and your users will thank you for it.
Remember: the best table is the one that gets out of the user’s way and lets them accomplish their goals efficiently. Everything else is just rows and columns.
Ninja Tables– Easiest Table Plugin in WordPress


Add your first comment to this post